📬 Trader Gu's Wave Report – July 2025
Monthly Newsletter - July 2025
Structured Analysis - High-Conviction Trading - Built for Part-Time Traders
⚡️ TL;DR – Quick Snapshot
👀 Developing Trades: $INTC, $LVMHF
🧲 Approaching Key Levels: $AMD, $HIMS, $VFC 🔭 HTF Watchlist: $COST 🌕 Bonus Idea: $MCD
👋 Hey traders,
Welcome to another edition of Trader Gu’s Wave Report - a monthly breakdown of how I’m evaluating the market, step by step.
Inside, you’ll find the tickers on my watchlist, the Areas of Interest (AOI) I’m looking to trade, and my thought process behind each setup.
Trading, much like surfing, isn’t about chasing every move. You sit. You scan the horizon. You wait. Then, when the right wave rolls in - you execute with conviction.
Let’s dive into what’s shaping up for July 👇
👀 Developing Trades - Inside my Area of Interest (AOI)
These are potential setups building in my area of interest and the ones that I am tracking on the daily and weekly time frames for potential trades.
$INTC – Time to Buy?
$INTC (Intel Corporation) has been ranging between $20–$25 for the past 8 months, and it’s finally starting to show signs of forming a high-timeframe bullish reversal pattern.
After the significant drop back in July 2024, we swept major liquidity from the 2012 low - and just recently, we also swept the liquidity from this 8-month range. Now, price is starting to push higher on the monthly chart.
We’re still technically in a bearish market structure, but if we can get a monthly close above $25, that would confirm a bullish reversal. The first target would then be the $30 bearish monthly order block.
This scenario looks increasingly likely, especially since we just closed the weekly candle above $22.20, confirming a bullish market structure shift on the weekly timeframe.
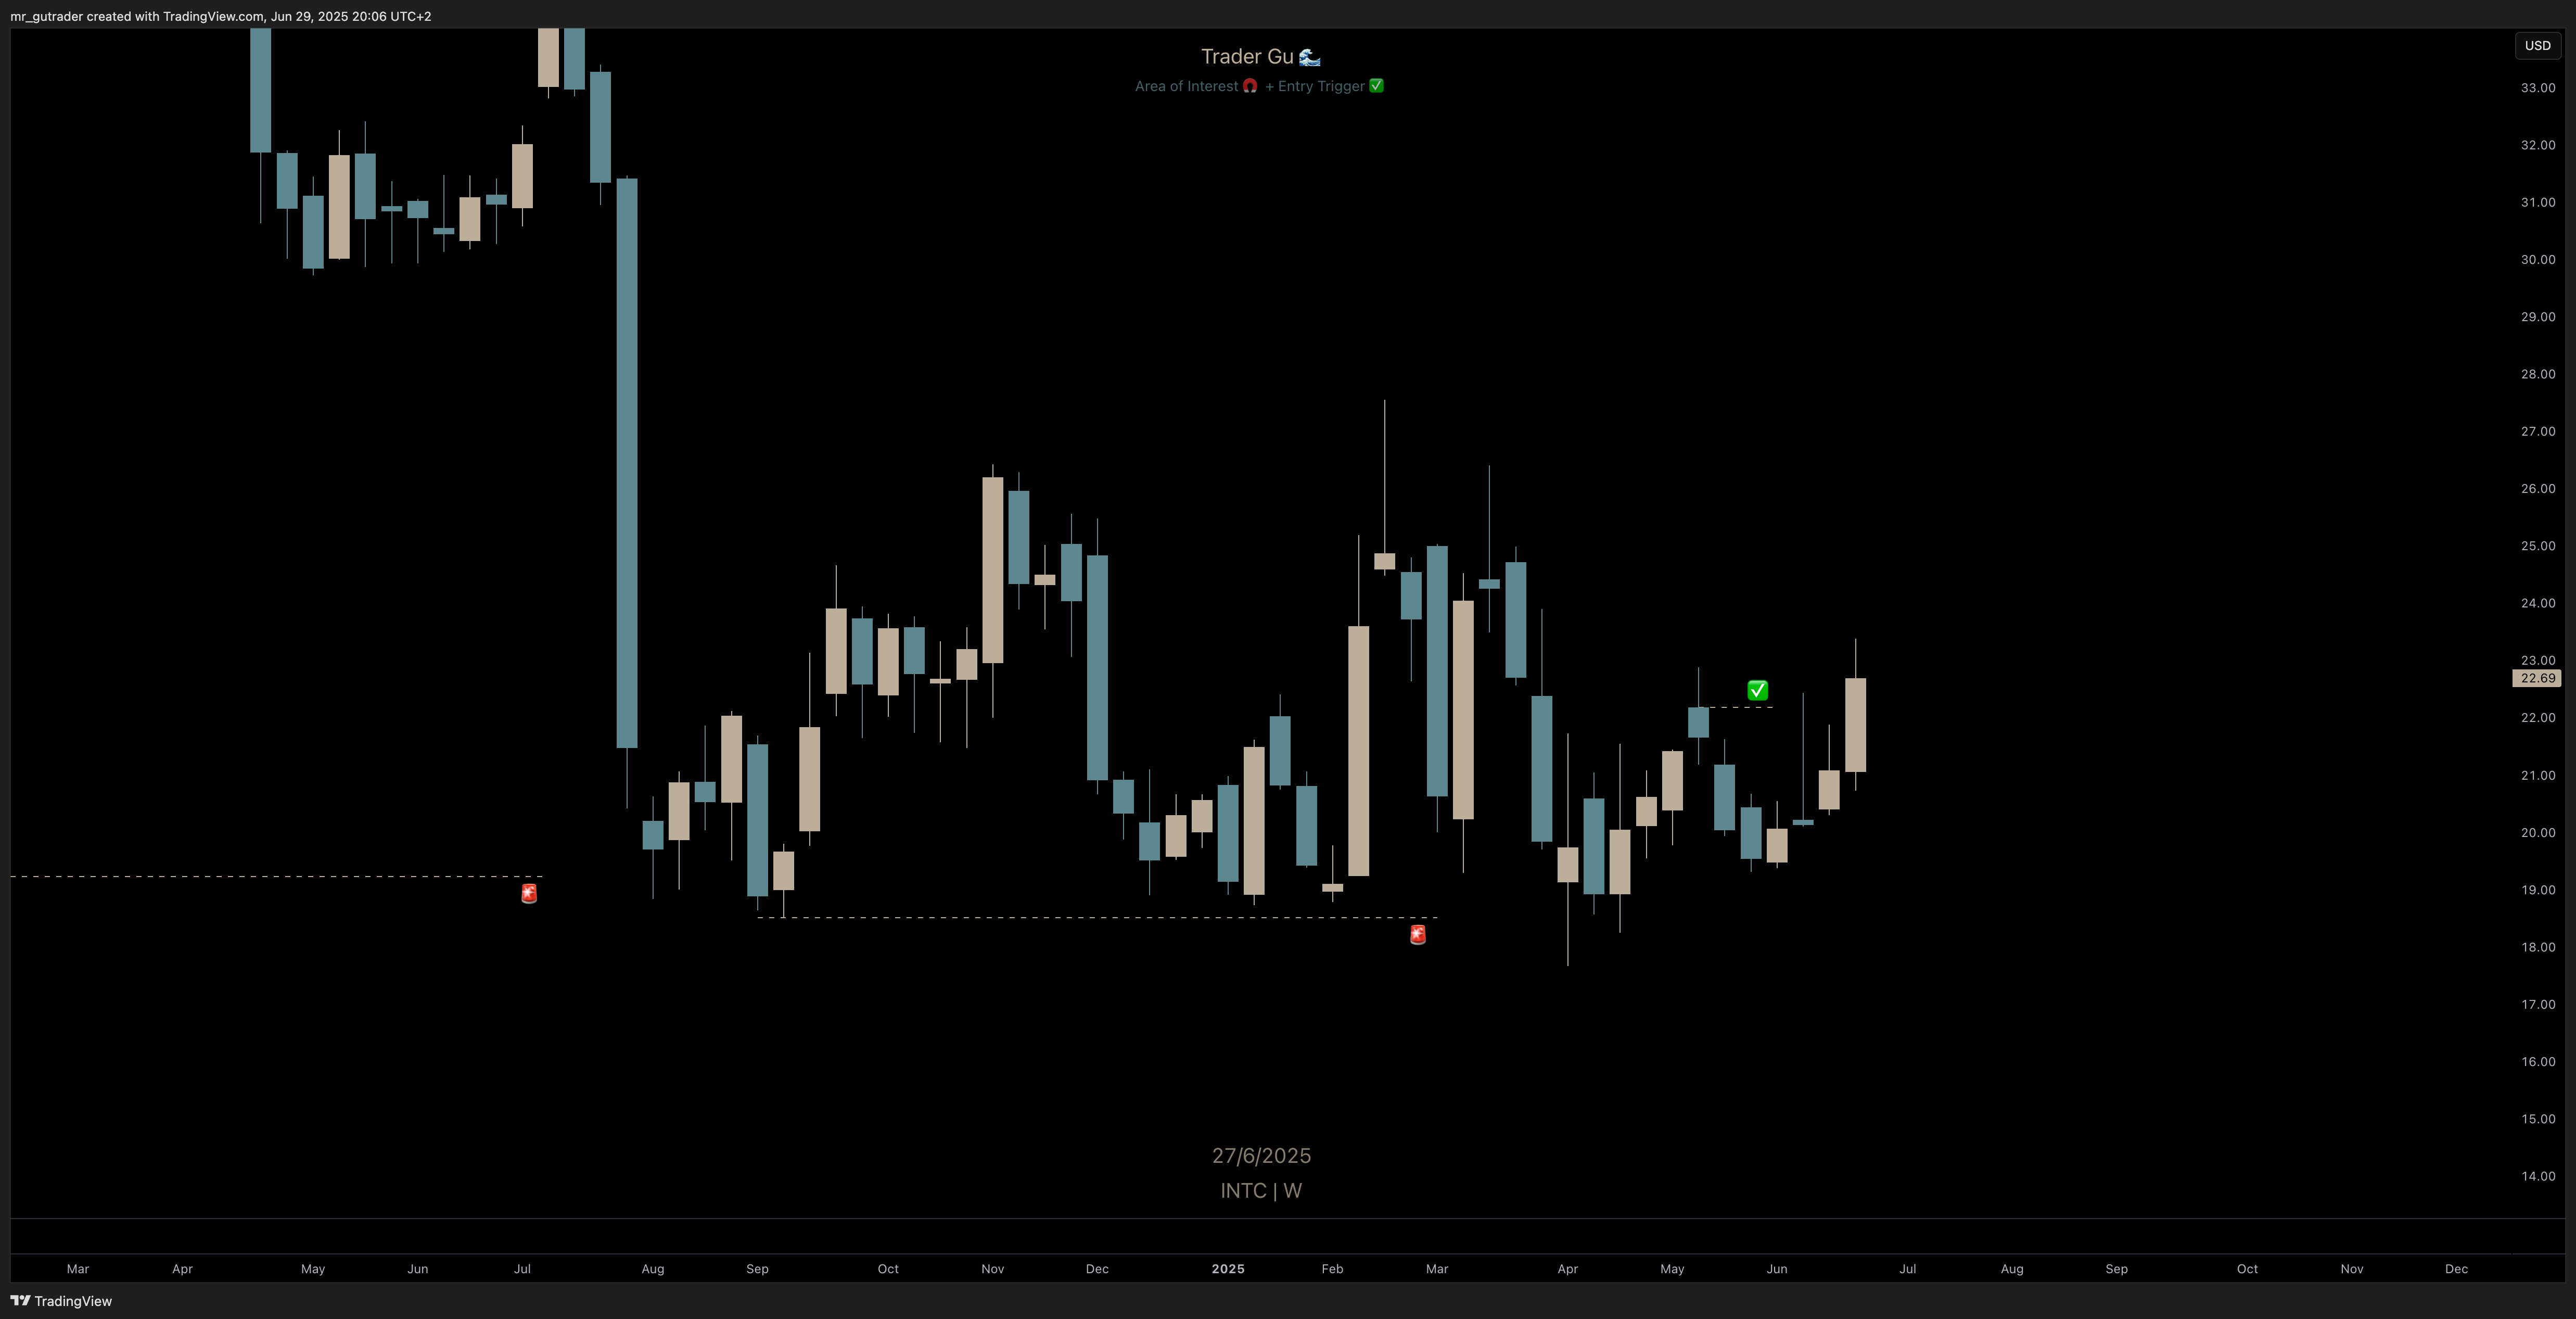 $INTC - Weekly
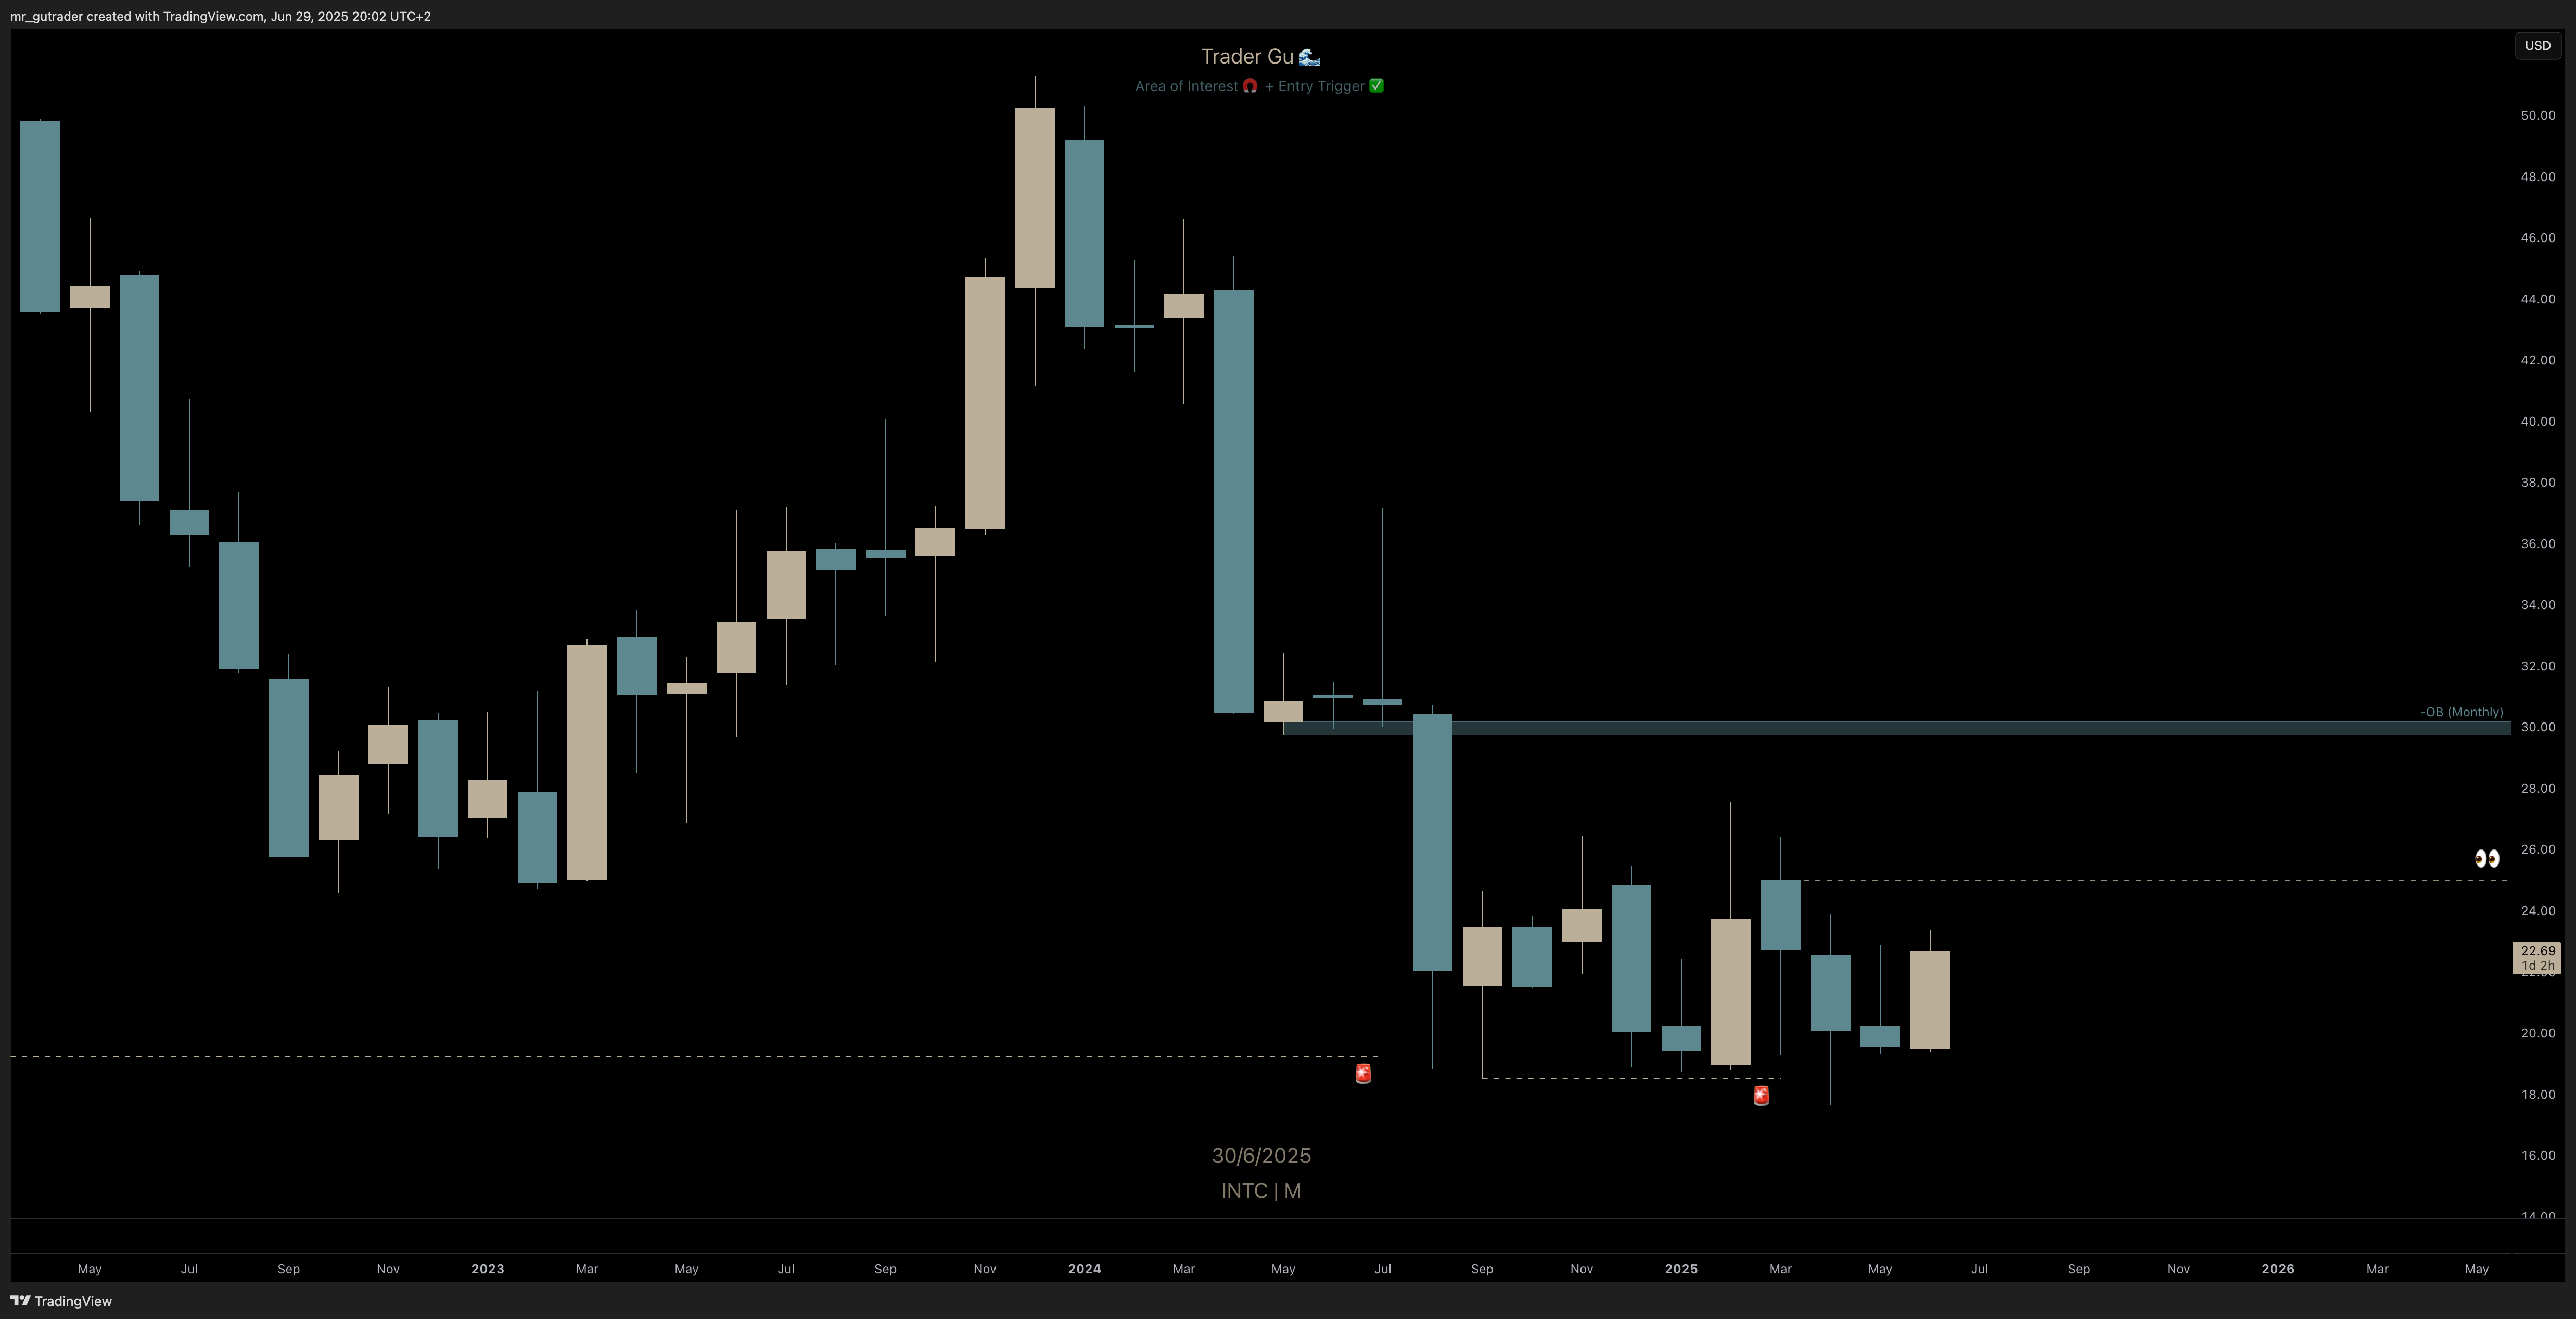 $INTC - Monthly
$LVMHF – Reversal at Major Support?
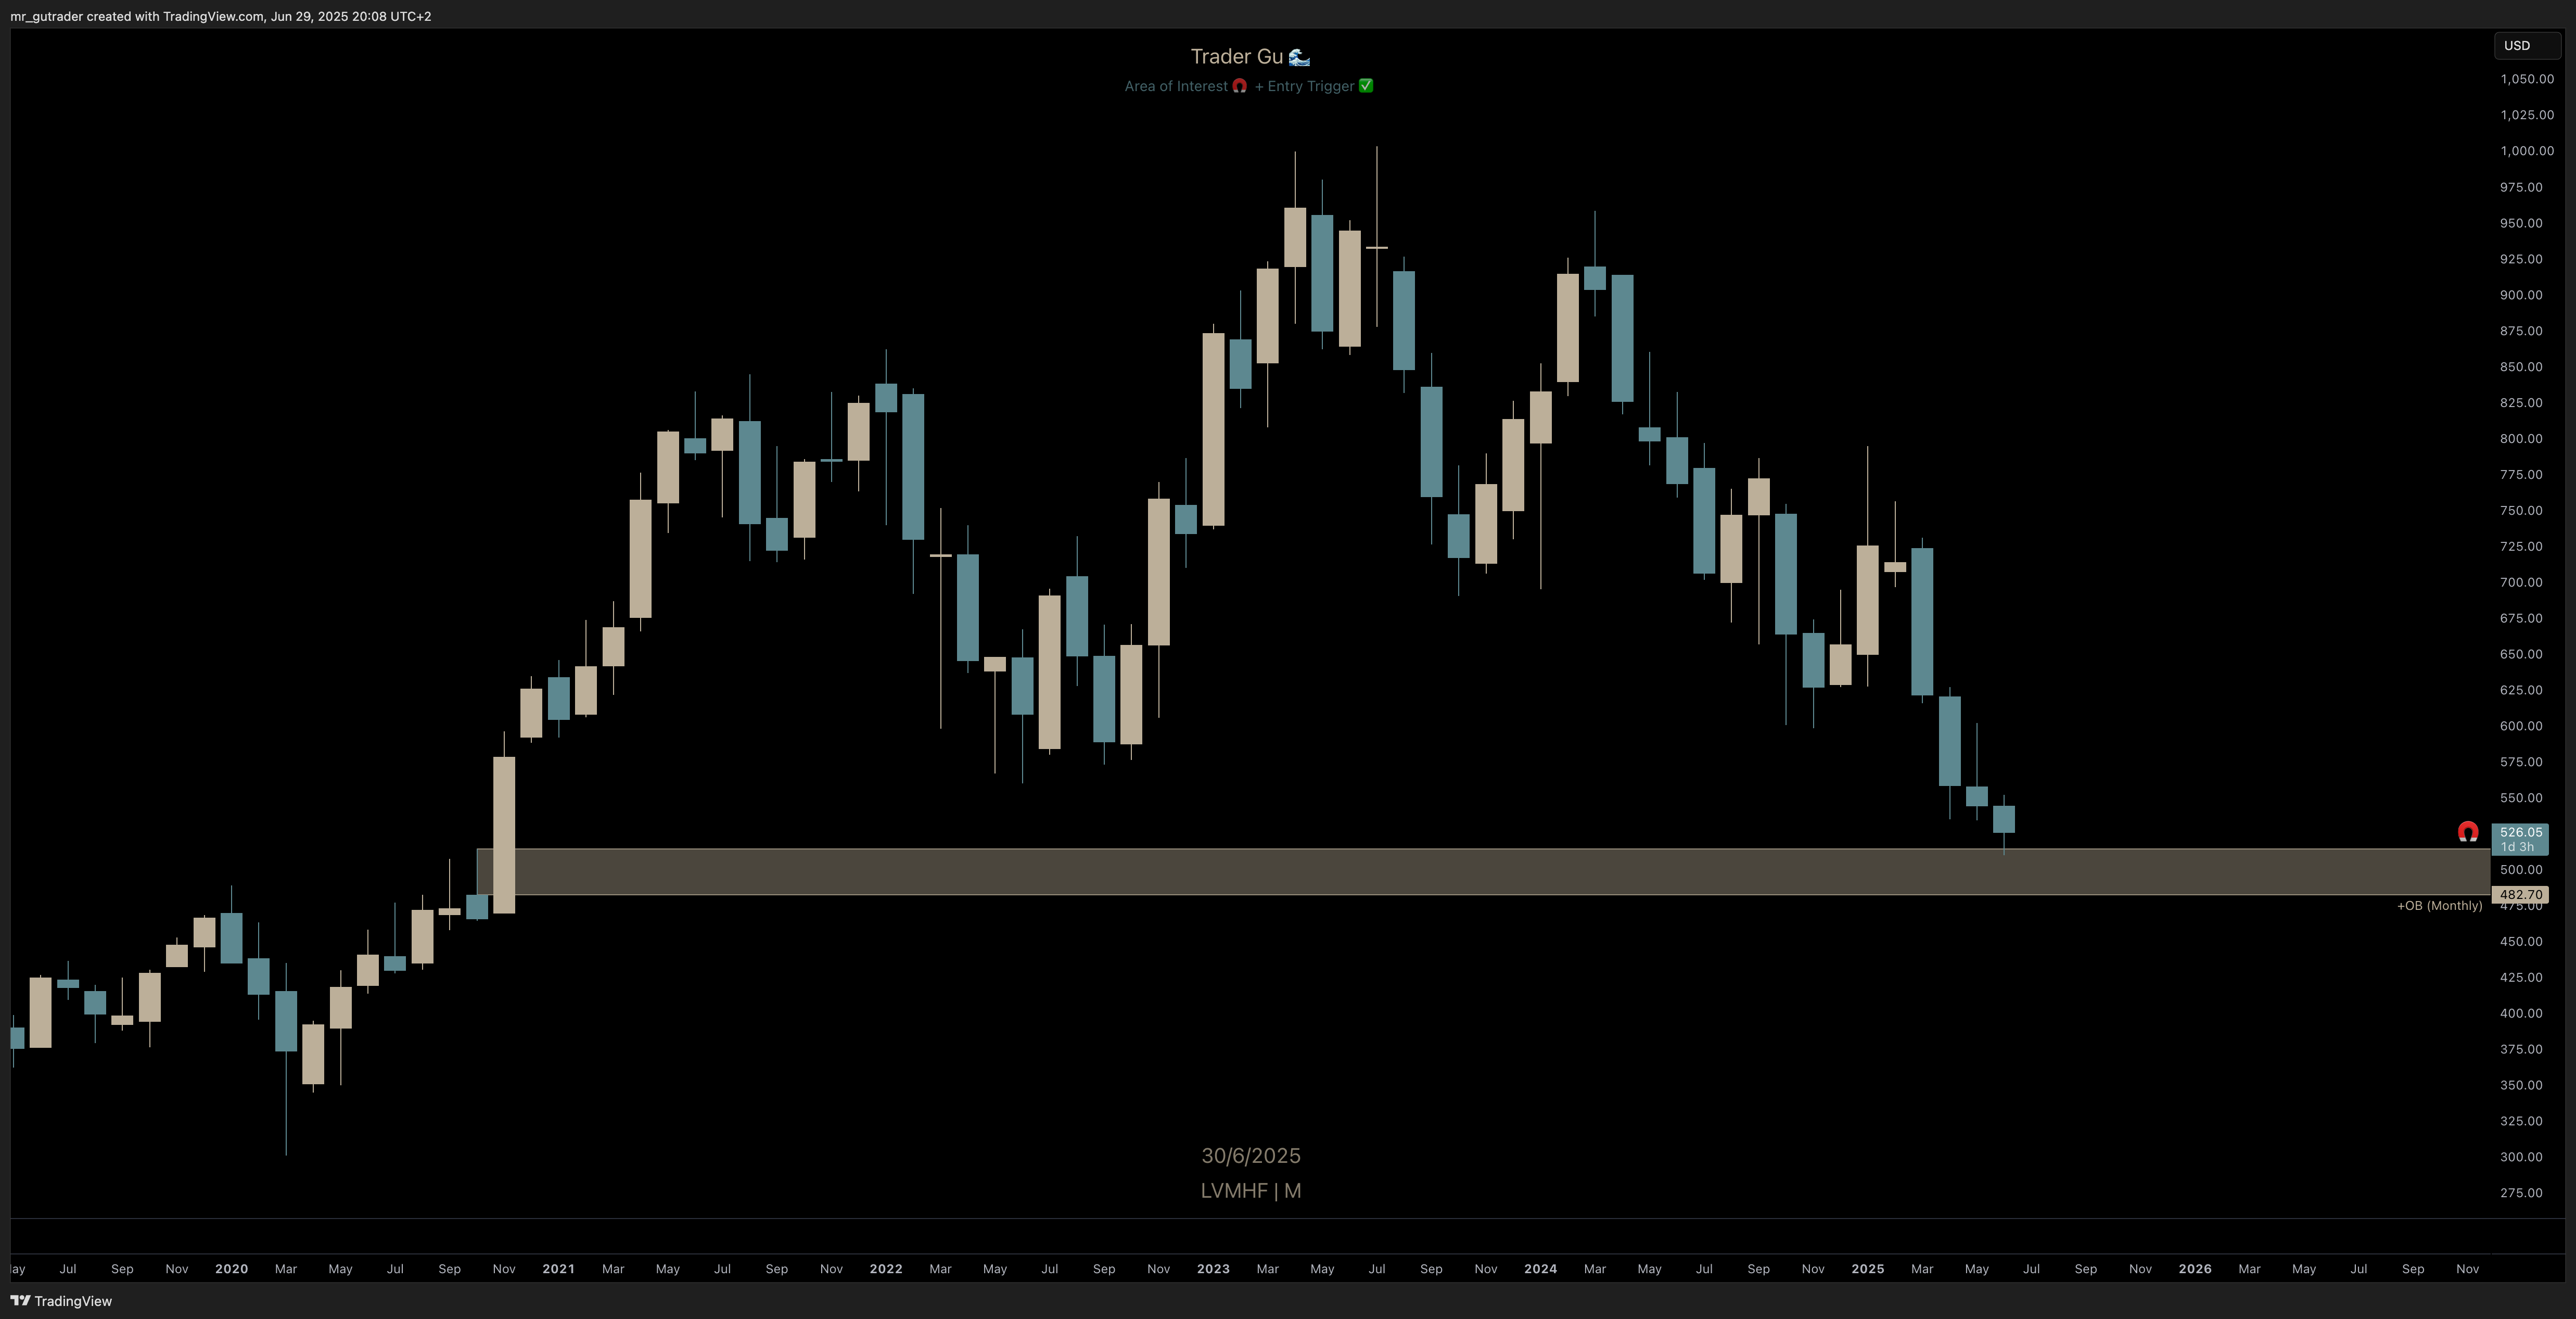
$LVMHF has been on a steep downward slope for the past two years, dropping nearly 50% from its all-time high in mid-2023. We’re now finally arriving at the significant monthly order block formed back in July–August 2021 - the same zone that launched price from $500 all the way to $9,000 and even briefly to $10,000. This level has never been retested - until now.
From a monthly perspective, we’re still in a bearish market structure, and to confirm a structural shift, we’d need a monthly close above $725. That’s still a long way off, and I typically look to enter based on the weekly timeframe once I see a confirmed bullish reversal pattern.
That hasn’t happened yet. For now, the key level I’m watching is $590 - a weekly close above that level would confirm a potential bullish setup. However, if price continues lower and taps the $482 zone, that could reset the structure entirely and shift where I look for confirmation.
This setup is staying on my daily watchlist. Ideally, we’ll see a high-conviction trade begin to build in the coming weeks or months.
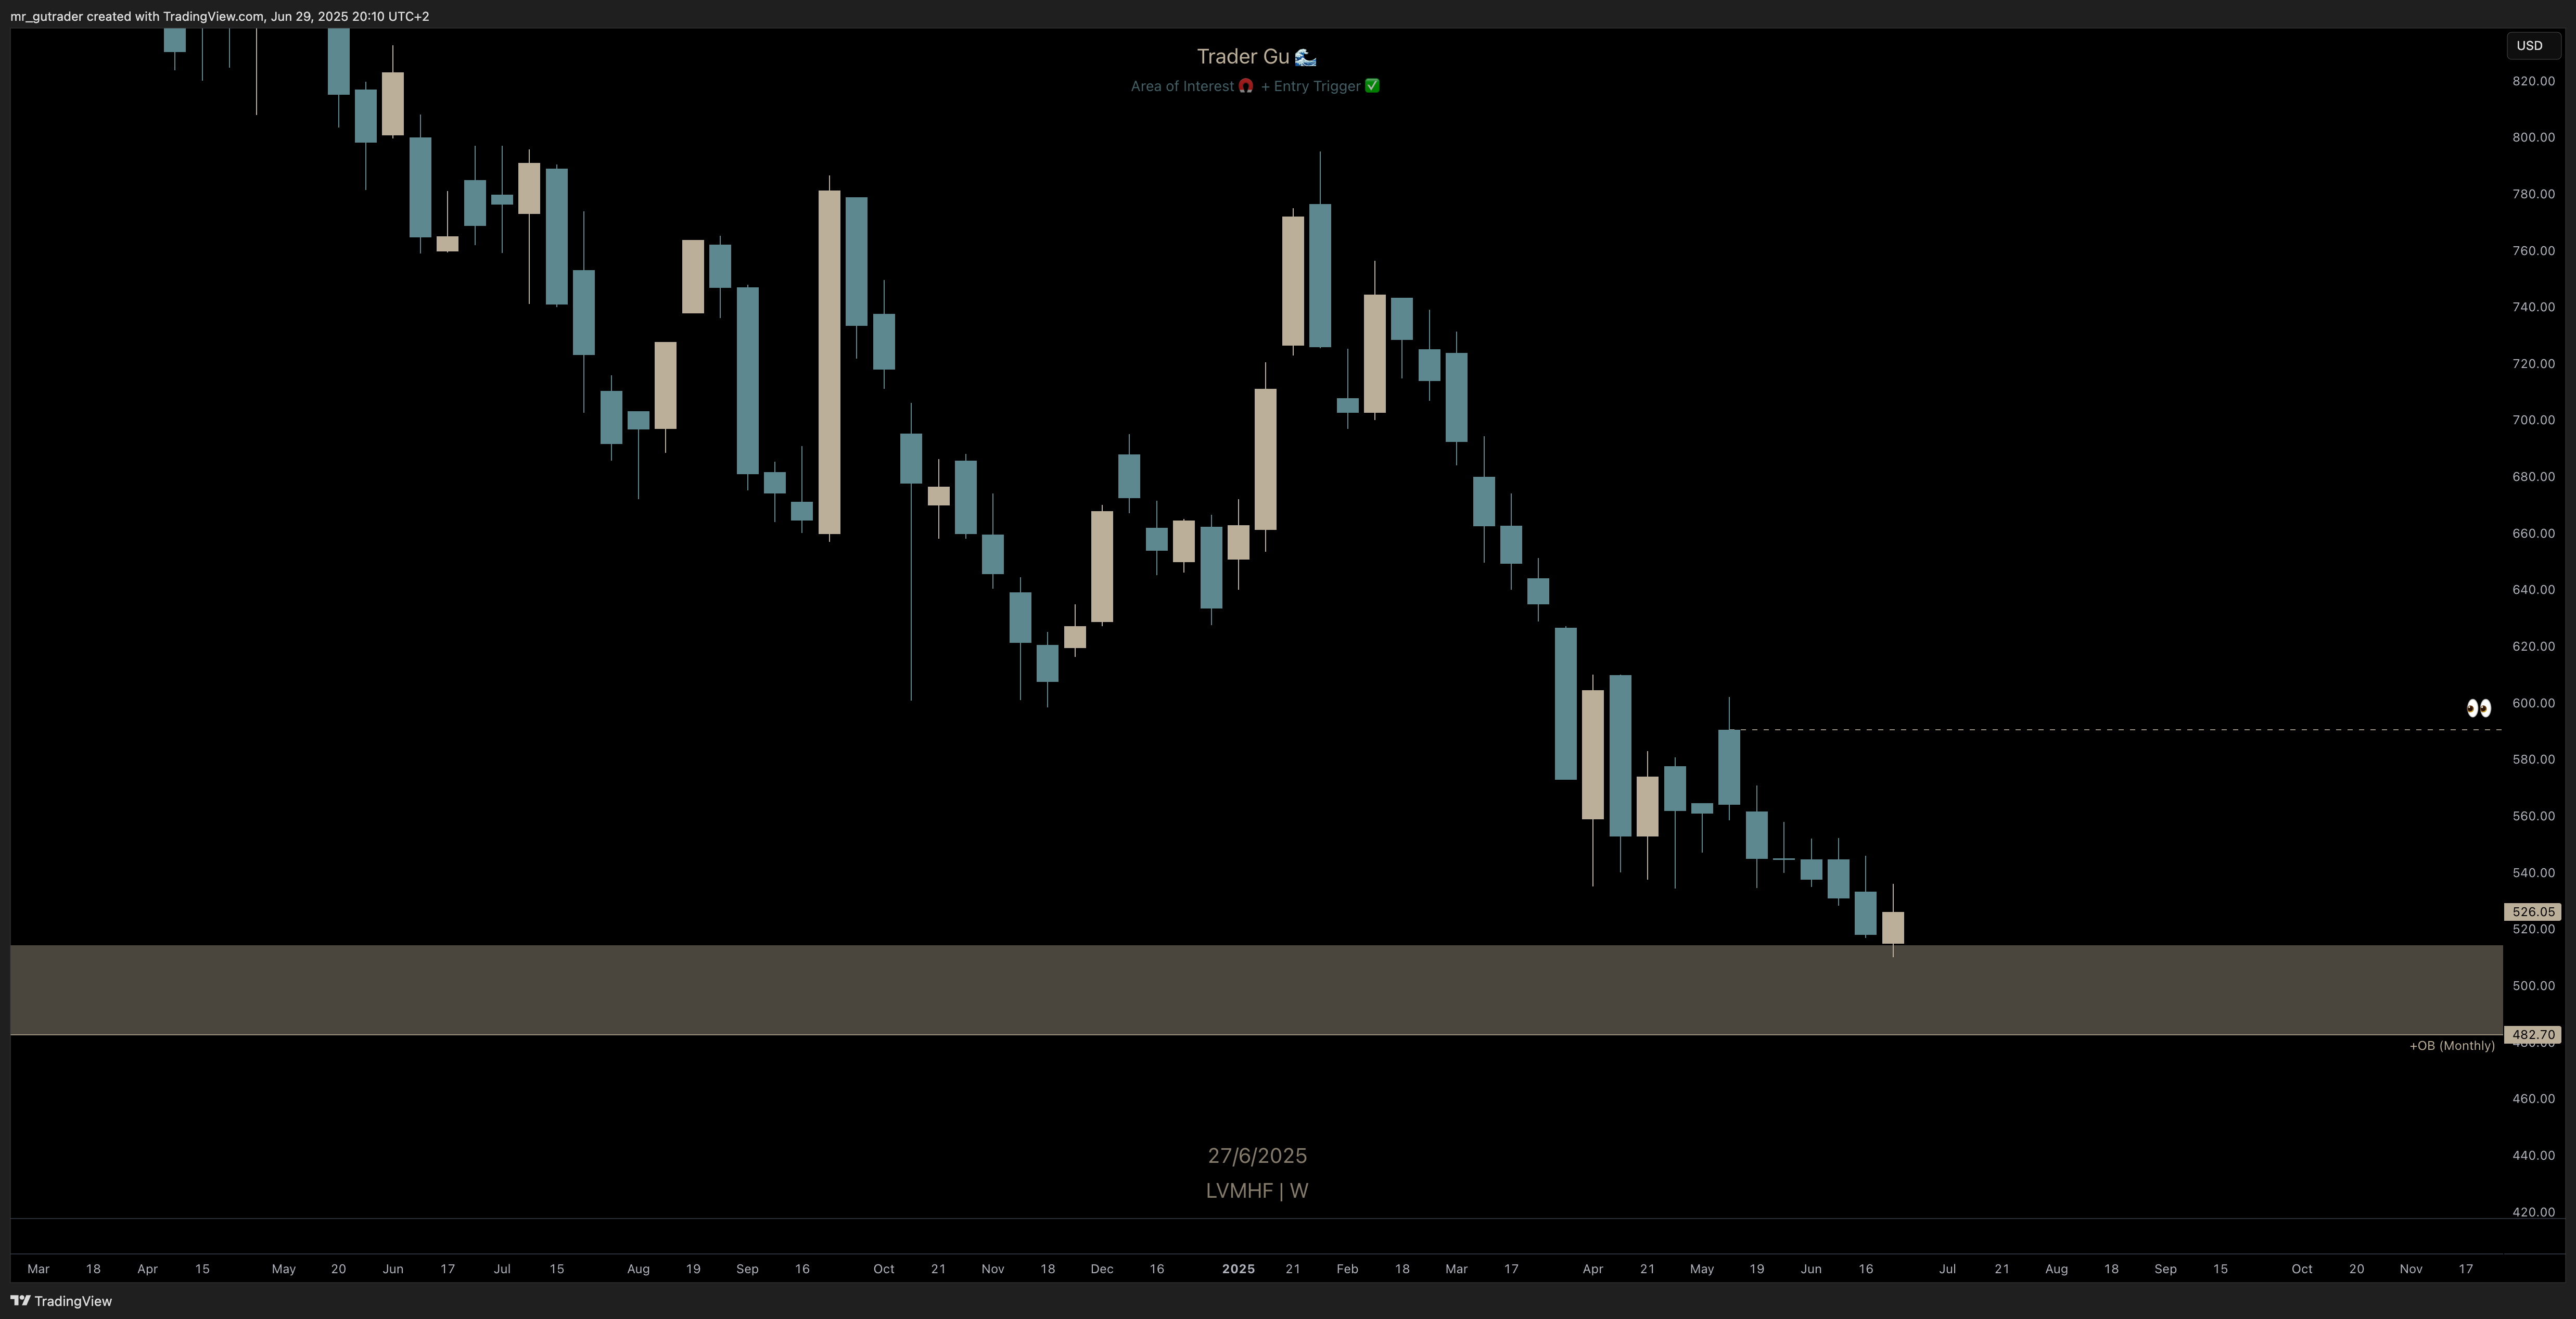 $LVMHF - Weekly
 $LVMHF - Monthly
🧲 Approaching my Area of Interest (AOI)
Tickers approaching my areas of interest often exhibit sharp, volatile reactions. Sometimes, price breaks down entirely. Other times, it begins to form a structure that can evolve into a trade over days, weeks even months.
When price reaches a high-conviction zone, I often consider aggressive entries - not because the setup is fully confirmed, but to ensure I’m positioned early at key levels while the trade thesis has time to develop.
$AMD - Waiting for retracement
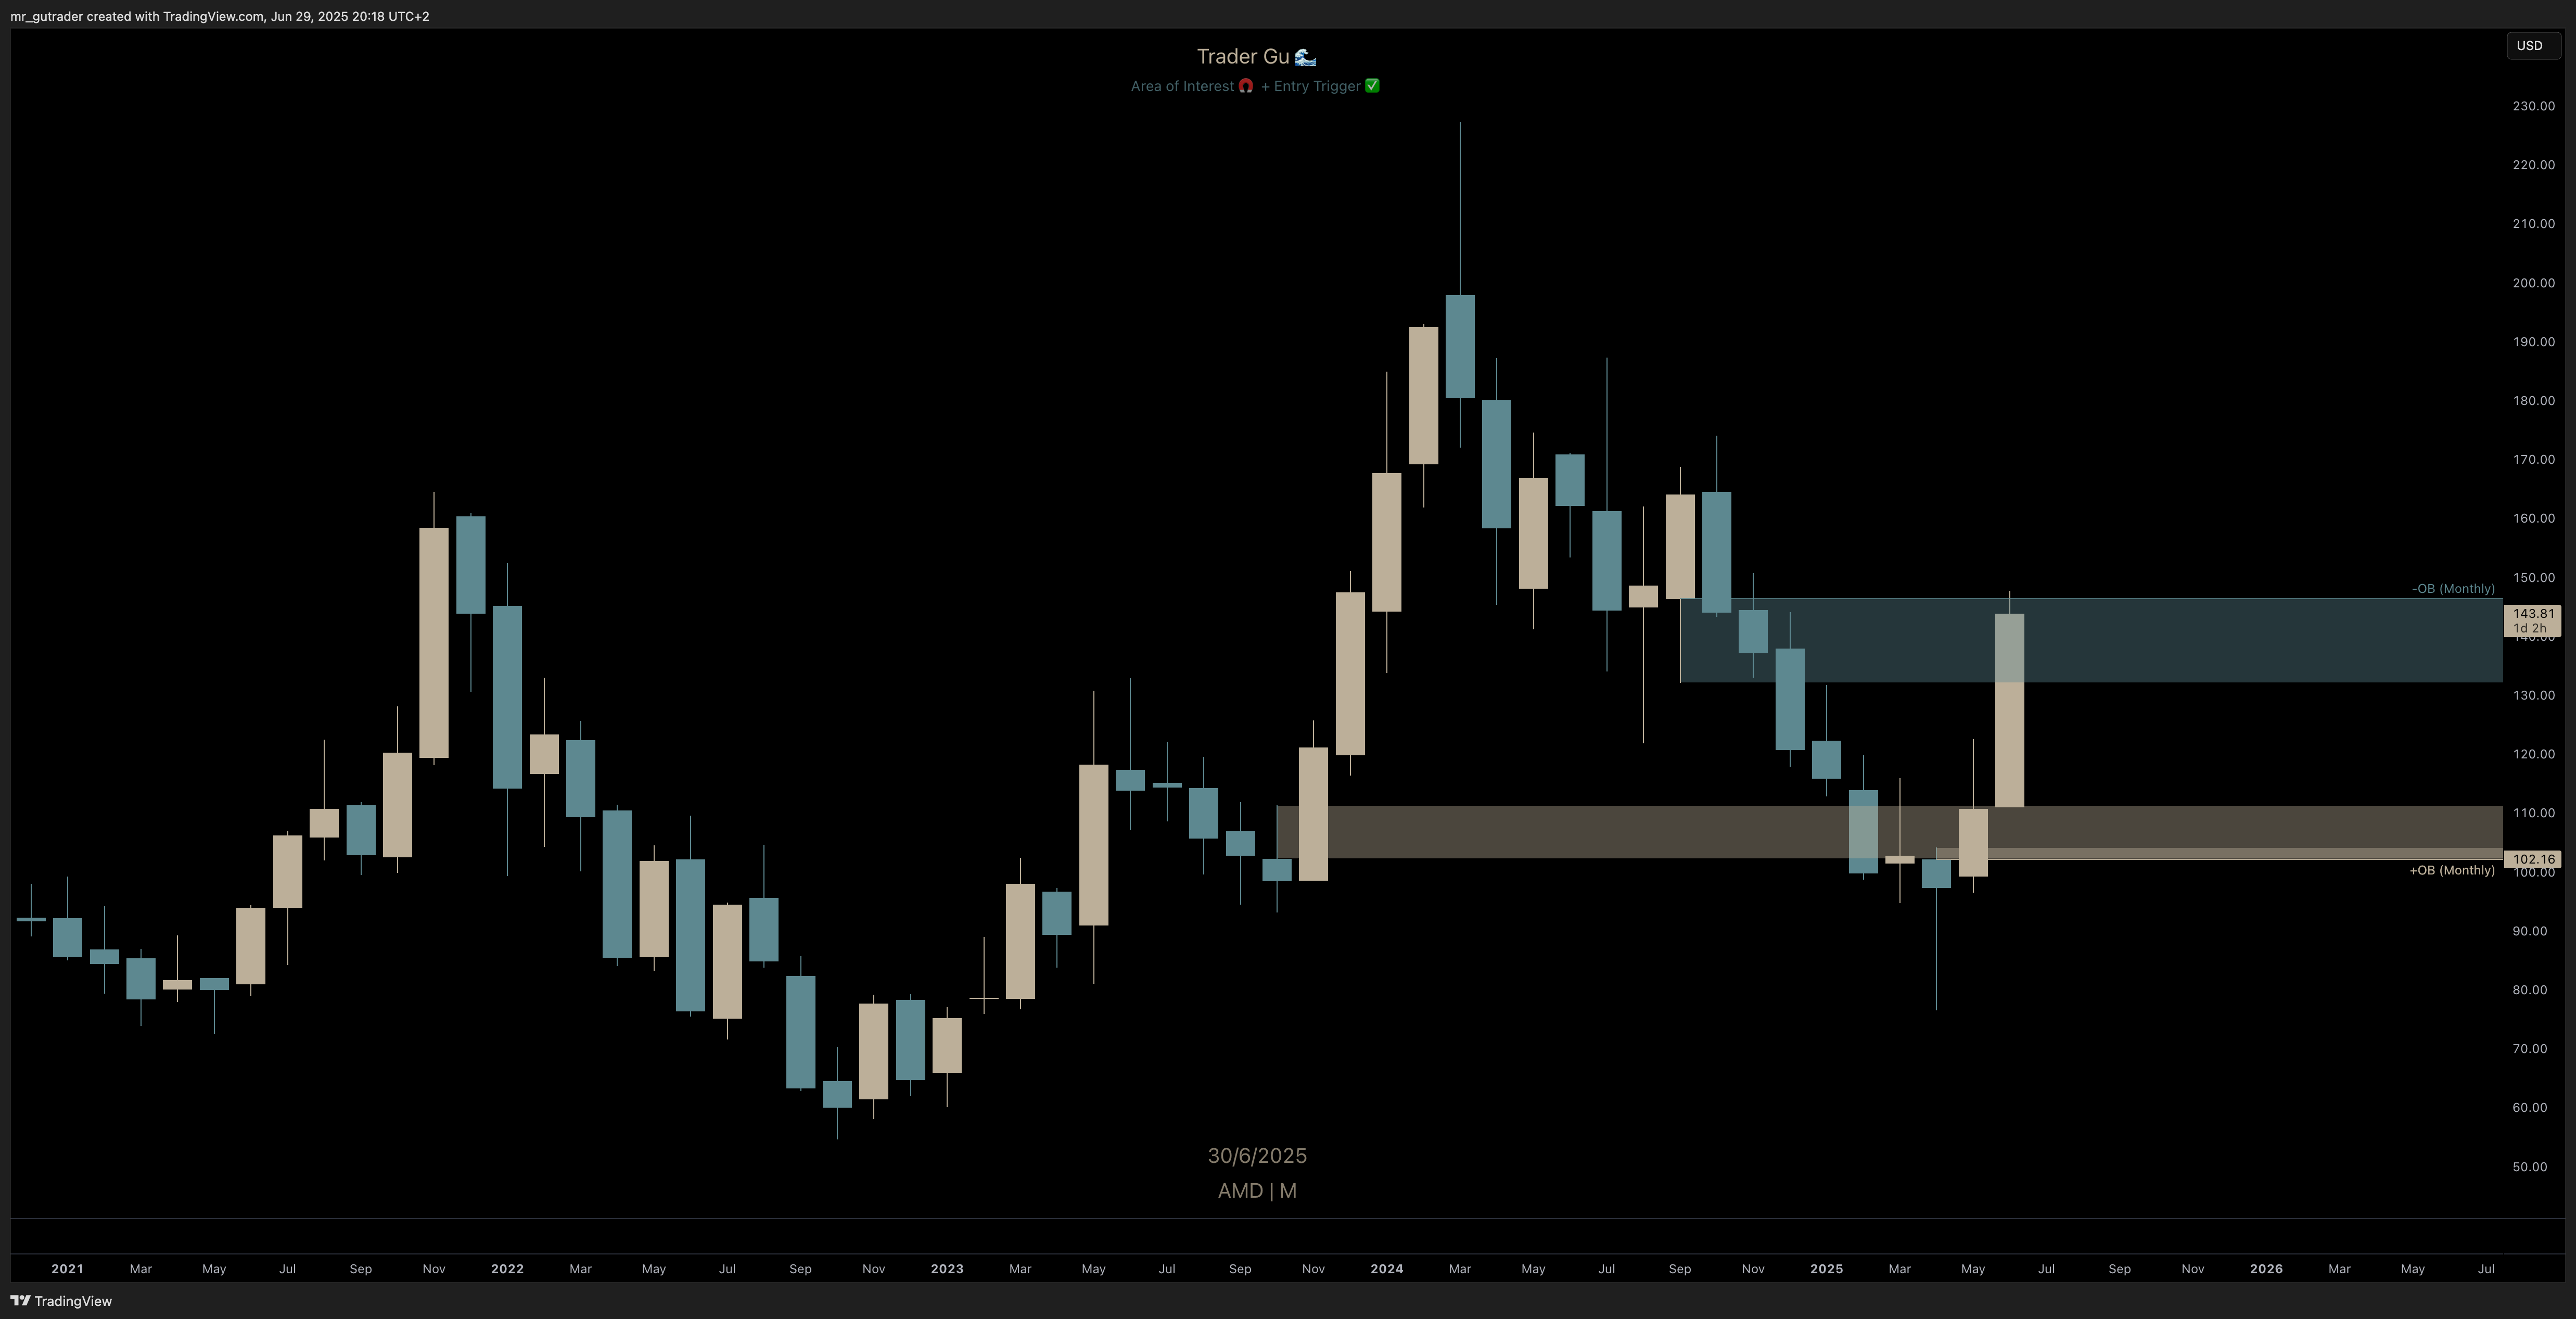
After recently realizing significant profit in an $AMD trade, I am now expecting or at least waiting for a possible retracement for a retest of the $102 newly formed monthly order block. As we have already confirmed a weekly bullish market structure shift, I could see that we are not reaching this new order block by but but reversing but retracing to the 110 level for me. After exiting such a profitable trade, I am now patiently waiting for price to move back to my area of interest to trade.
 $AMD - Monthly
$HIMS - Waiting for the Retest
$HIMS (Hims & Hers) made headlines earlier this year after a strong move to the upside. The stock confirmed a bullish market structure on the weekly, then launched from the $30–$40 range up to $68.
A few weeks later, however, the stock dropped sharply - losing 30% in a single day after Novo Nordisk announced the cancellation of one of their partnerships. That event wiped out a good chunk of short-term gains and sent the stock back into a more volatile zone.
Interestingly, we’ve never retested the key weekly bullish order block at $28–$30, nor the breakout level around $39. I’m patiently waiting for price to move back into that area before evaluating whether there’s a setup that fits my criteria.
There’s clearly momentum in $HIMS - and if the structure aligns, I plan to take full advantage.
 $HIMS - Weekly
$VFC – A Different Kind of Setup
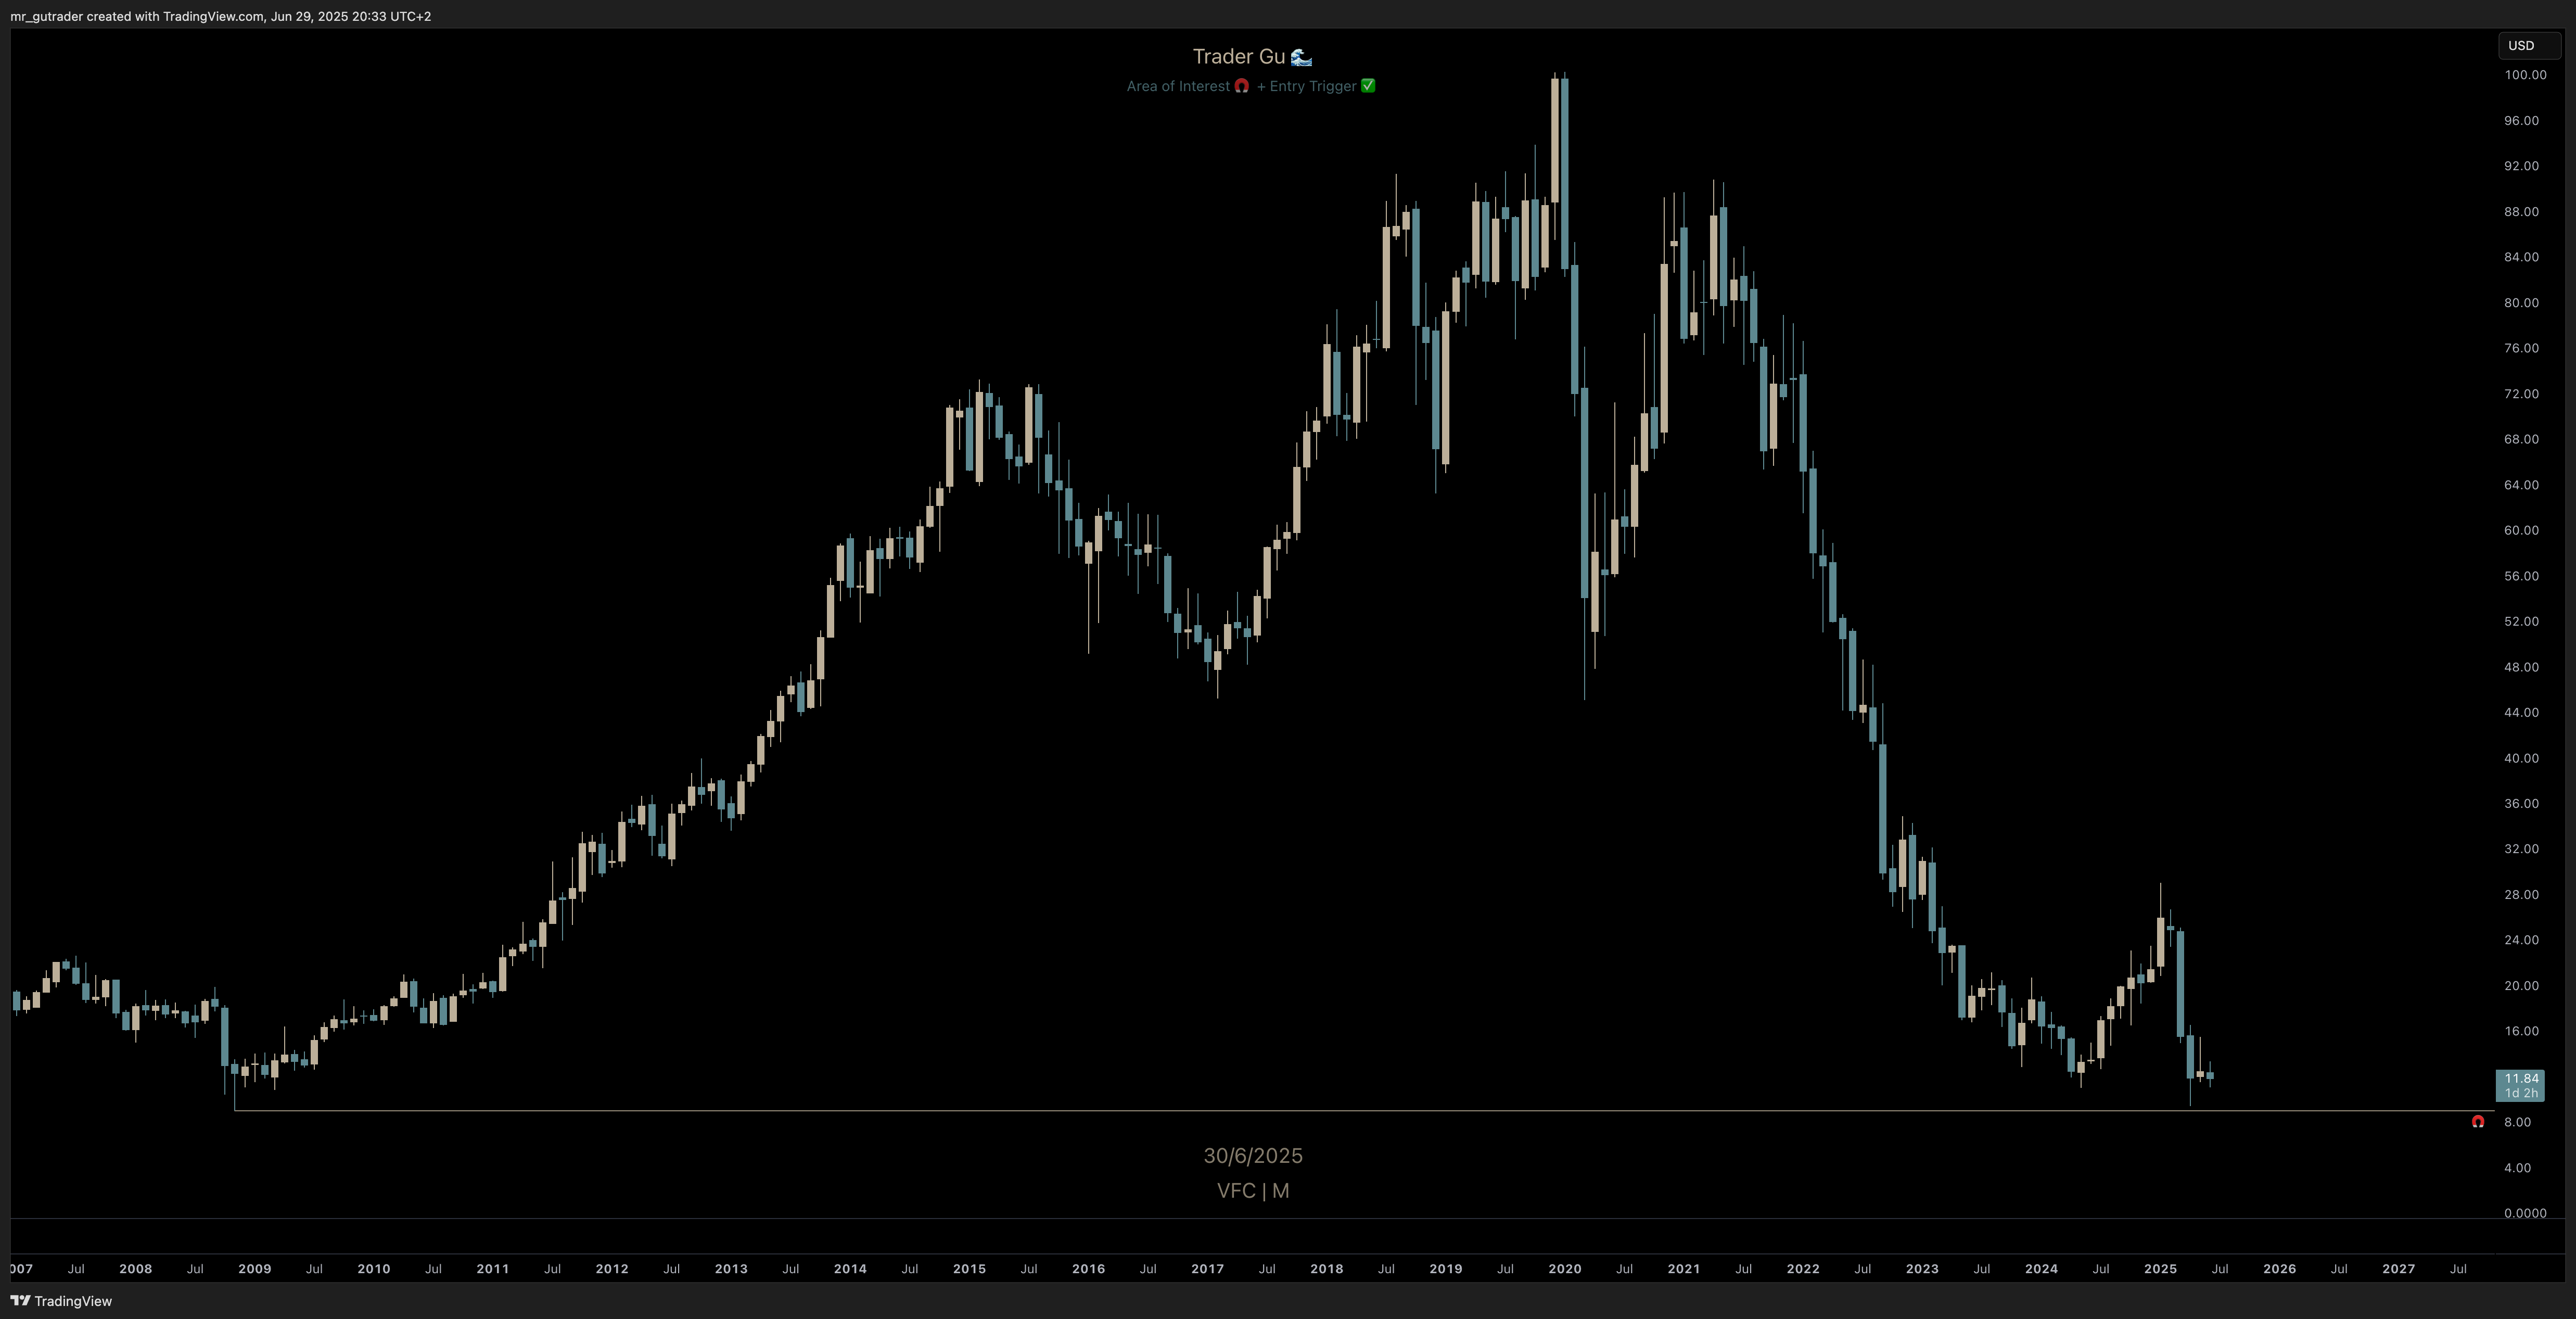
$VFC (VF Corporation) is a new addition to my equity watchlist. It caught my attention after a massive 5-year move to the downside, bringing us close to the 2008 bottom. While we haven’t yet taken the $9 liquidity, we’re starting to form an interesting pattern just above that level.
I’m expecting price to push a bit further south and sweep that liquidity. If it does, I see a high probability of a strong reaction, which could set the stage for a potential trade setup in the coming weeks or months.
If you’ve followed my previous trades or my Order Block Trading Strategy, this setup might look a bit different from what I’ve typically shared. I use a few different entry frameworks - and in future Toolbox updates, I plan to showcase more of those variations.
 $VFC - Monthly
🔭 Long-Term Watchlist
These are tickers I’m monitoring on the monthly or higher timeframes. While they may currently be far from my area of interest, I track them to stay aware of how price evolves as it approaches key levels. Monitoring on the higher timeframes allows me to prepare well in advance and be ready to position myself when trade opportunities emerge.
Long-term positions require long-term planning. That includes not just the technical setup, but also making sure I have capital available to allocate when the time is right.
$COST – Patience Required
$COST (Costco Inc.) has made a significant move without any real retracement since breaking out above the $550 level, rallying all the way toward the current all-time high at $1,075. In the process, it left behind an untested monthly bullish order block - a zone that I believe will eventually be revisited.
Recently, we’ve seen price flip between bullish and bearish market structures on the weekly timeframe, adding some short-term uncertainty. But on the monthly, the structure is clear: a major retracement looks increasingly likely.
If that happens, I’ll be watching the $730–$780 monthly order block. It’s possible we get a clean retest - but I’m also open to a deeper move that invalidates the order block, sweeping liquidity around $700 before reversing.
Either way, I’m interested in a setup if we get the right confirmation - whether it forms inside the block or after a deeper sweep. This one could take time to develop, but it’s definitely on my radar.
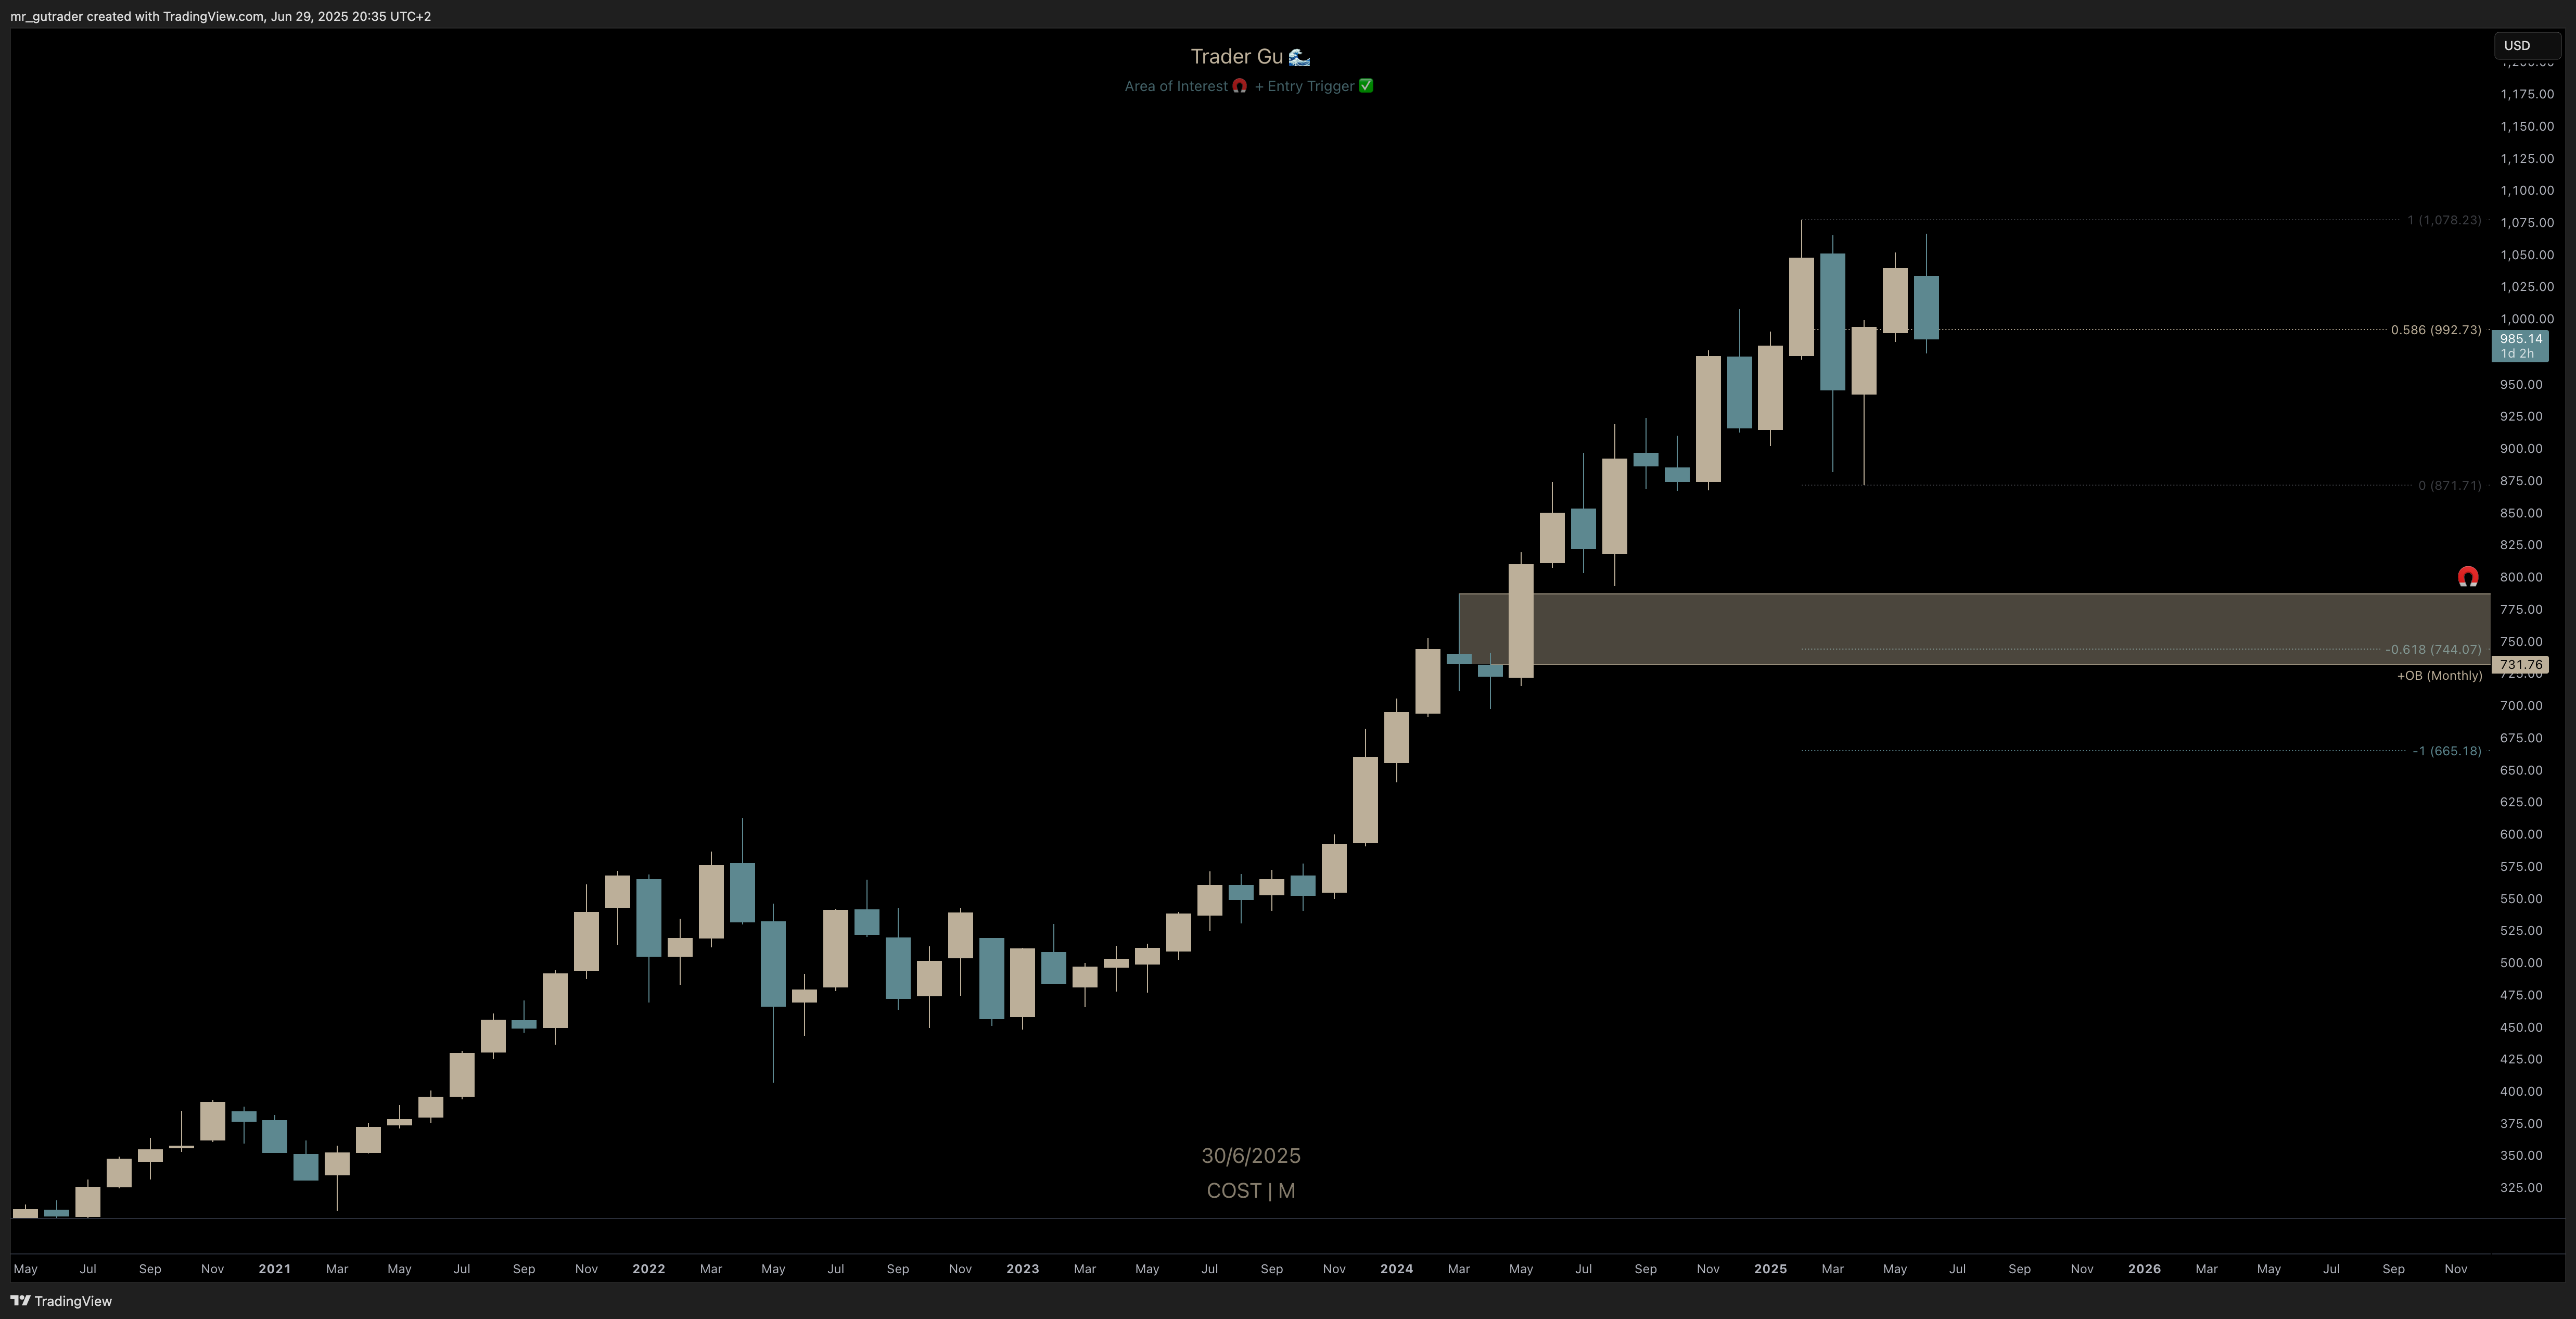 $COST - Monthly
🌕 Bonus Chart
$MCD - Moving to ATH or $263 Order Block?
McDonald’s ($MCD) is this month’s bonus chart — and for good reason. Price is currently retesting the $290–$295 monthly order block, and with the monthly close just around the corner, we could be setting up for one of two clear paths:
We close above $290, the bullish order block holds, and we build strength for a move back toward the all-time high at $326.
We close below $290, increasing the probability of a deeper move down to retest the $257–$265 order block.
From the monthly close providing some clarity, the weekly timeframe will guide how I interpret price action and where we are heading.
Personally, I’m in no rush to enter a trade on $MCD. But if we head lower and start building structure around that $263-$258 area, I’ll be paying close attention. If the trigger shows up, I’m interested.
 $MCD - Monthly
🌊 Wave Report Follow-up
It’s been a relatively quiet month for the setups from the previous Wave Report. $JD is still hovering just above the monthly bullish order block - no entry yet, but it remains on my radar.
$ASML confirmed a weekly bullish market structure, and while I was waiting for a pullback to enter, the retracement never came. The move continued without me - a reminder that missed trades are part of the process.
Overall, this is a month that reinforces the core of my strategy: focus only on high-conviction setups and don’t force trades when the structure isn’t there.
💡 Final Thought:
Not every month will be active - and that’s perfectly fine. I’m currently managing a few strong positions and watching key levels develop. With the S&P 500 hitting new all-time highs, the coming monthly close will be important in shaping the next wave of opportunities.
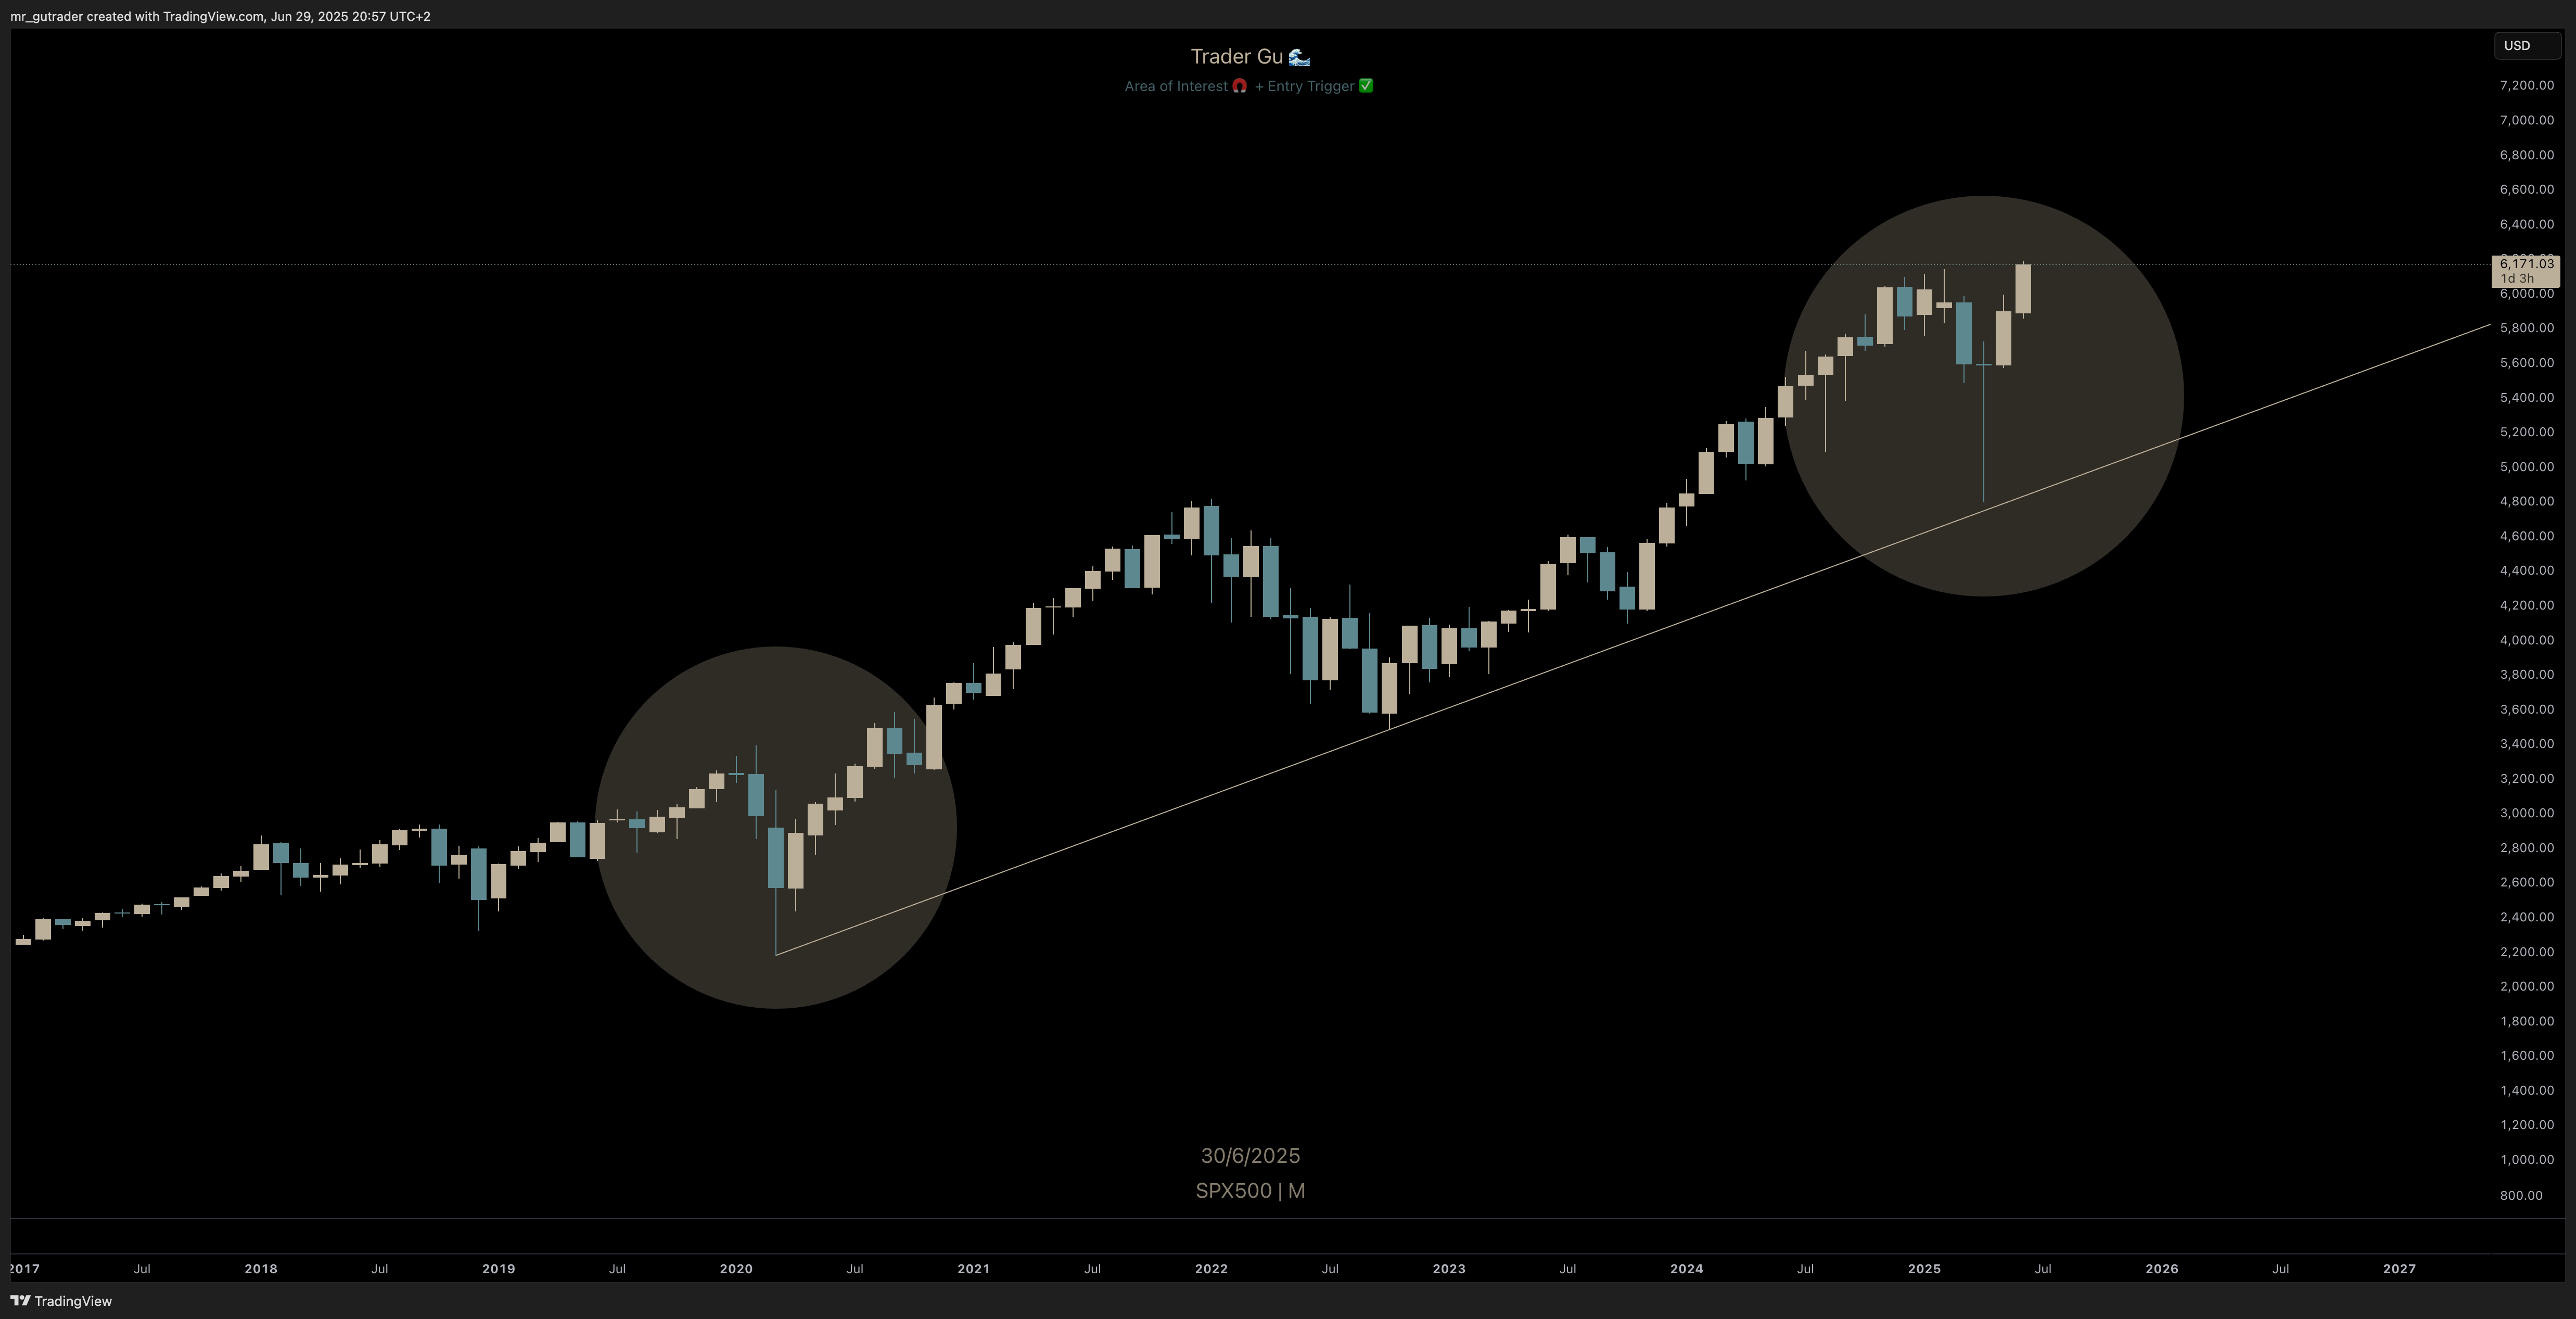 $S&P500 - Monthly
Until next month,
– Trader Gu
🔧 Want To Dive Deeper?
If you’re looking to refine your own trading process, I’ve built a free toolbox with the exact tools, workflows, and strategy templates I use as a part-time trader.
→ Explore the The Part-Time Trader’s Toolbox:
Tools, Strategies & Insights for High-Conviction Trading 🧲
👇 Let’s Trade Notes
Are you positioned in any of the tickers mentioned in this month’s report?
Got your eye on a setup I didn’t cover?
Send me a message on X or Substack — I’d love to hear what you’re watching ✍️