💼 Portfolio Update: 25 Year Trading Experiment | September 2025
Time flies, and it’s already 8 months into my 25 Year Trading Experiment. The past month has delivered outstanding results for my Actively Traded portfolio, and it’s time for a monthly breakdown.
All trades are always shared live on X.com/tradergu, and the public trading dashboard is always updated with the latest trade details and up-to-date portfolio allocations.
Performance: Year to Date
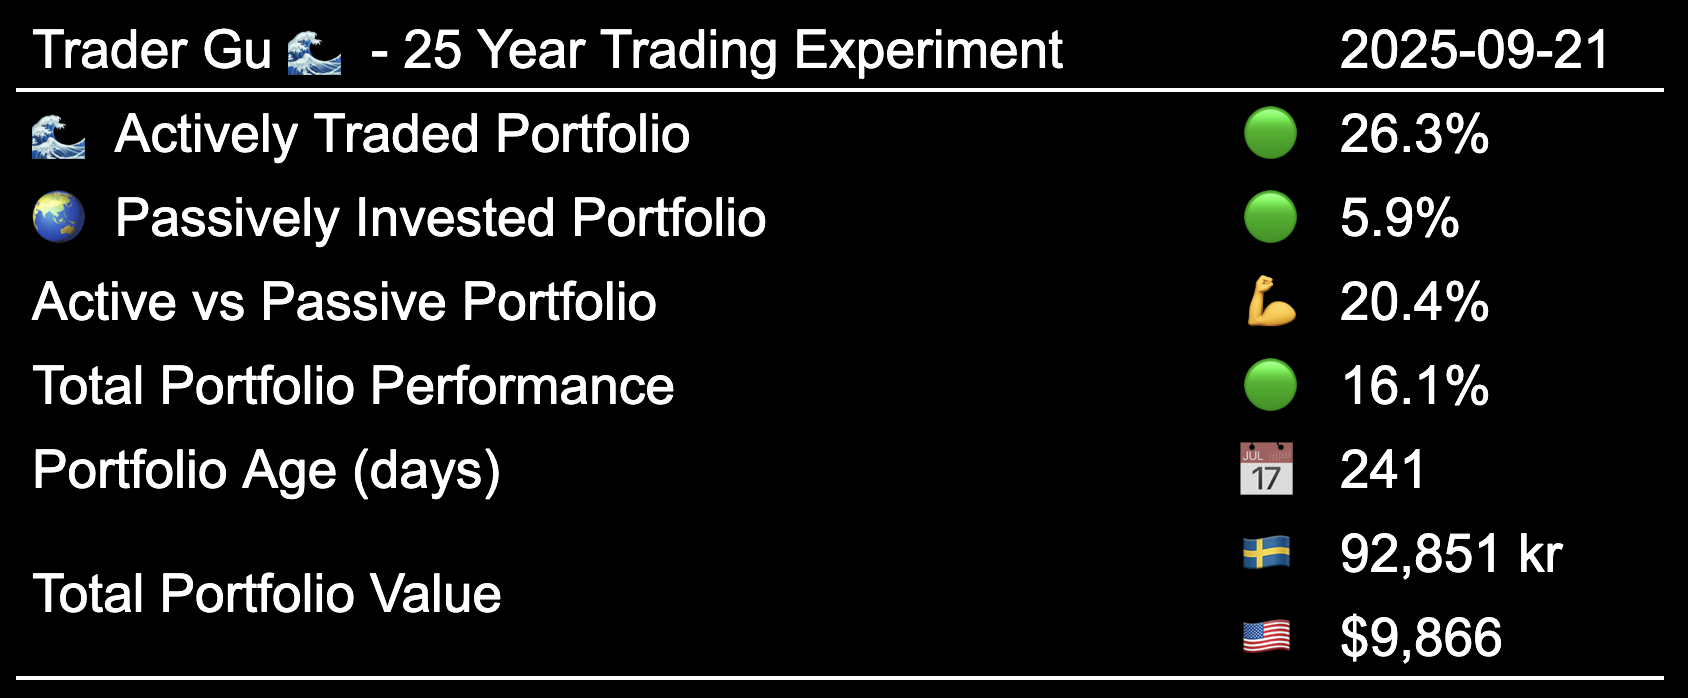
Both portfolios are in profit, and the Actively Traded Portfolio has outperformed the Passively Invested Portfolio by a whopping 💪 20.4 percentage points year to date.
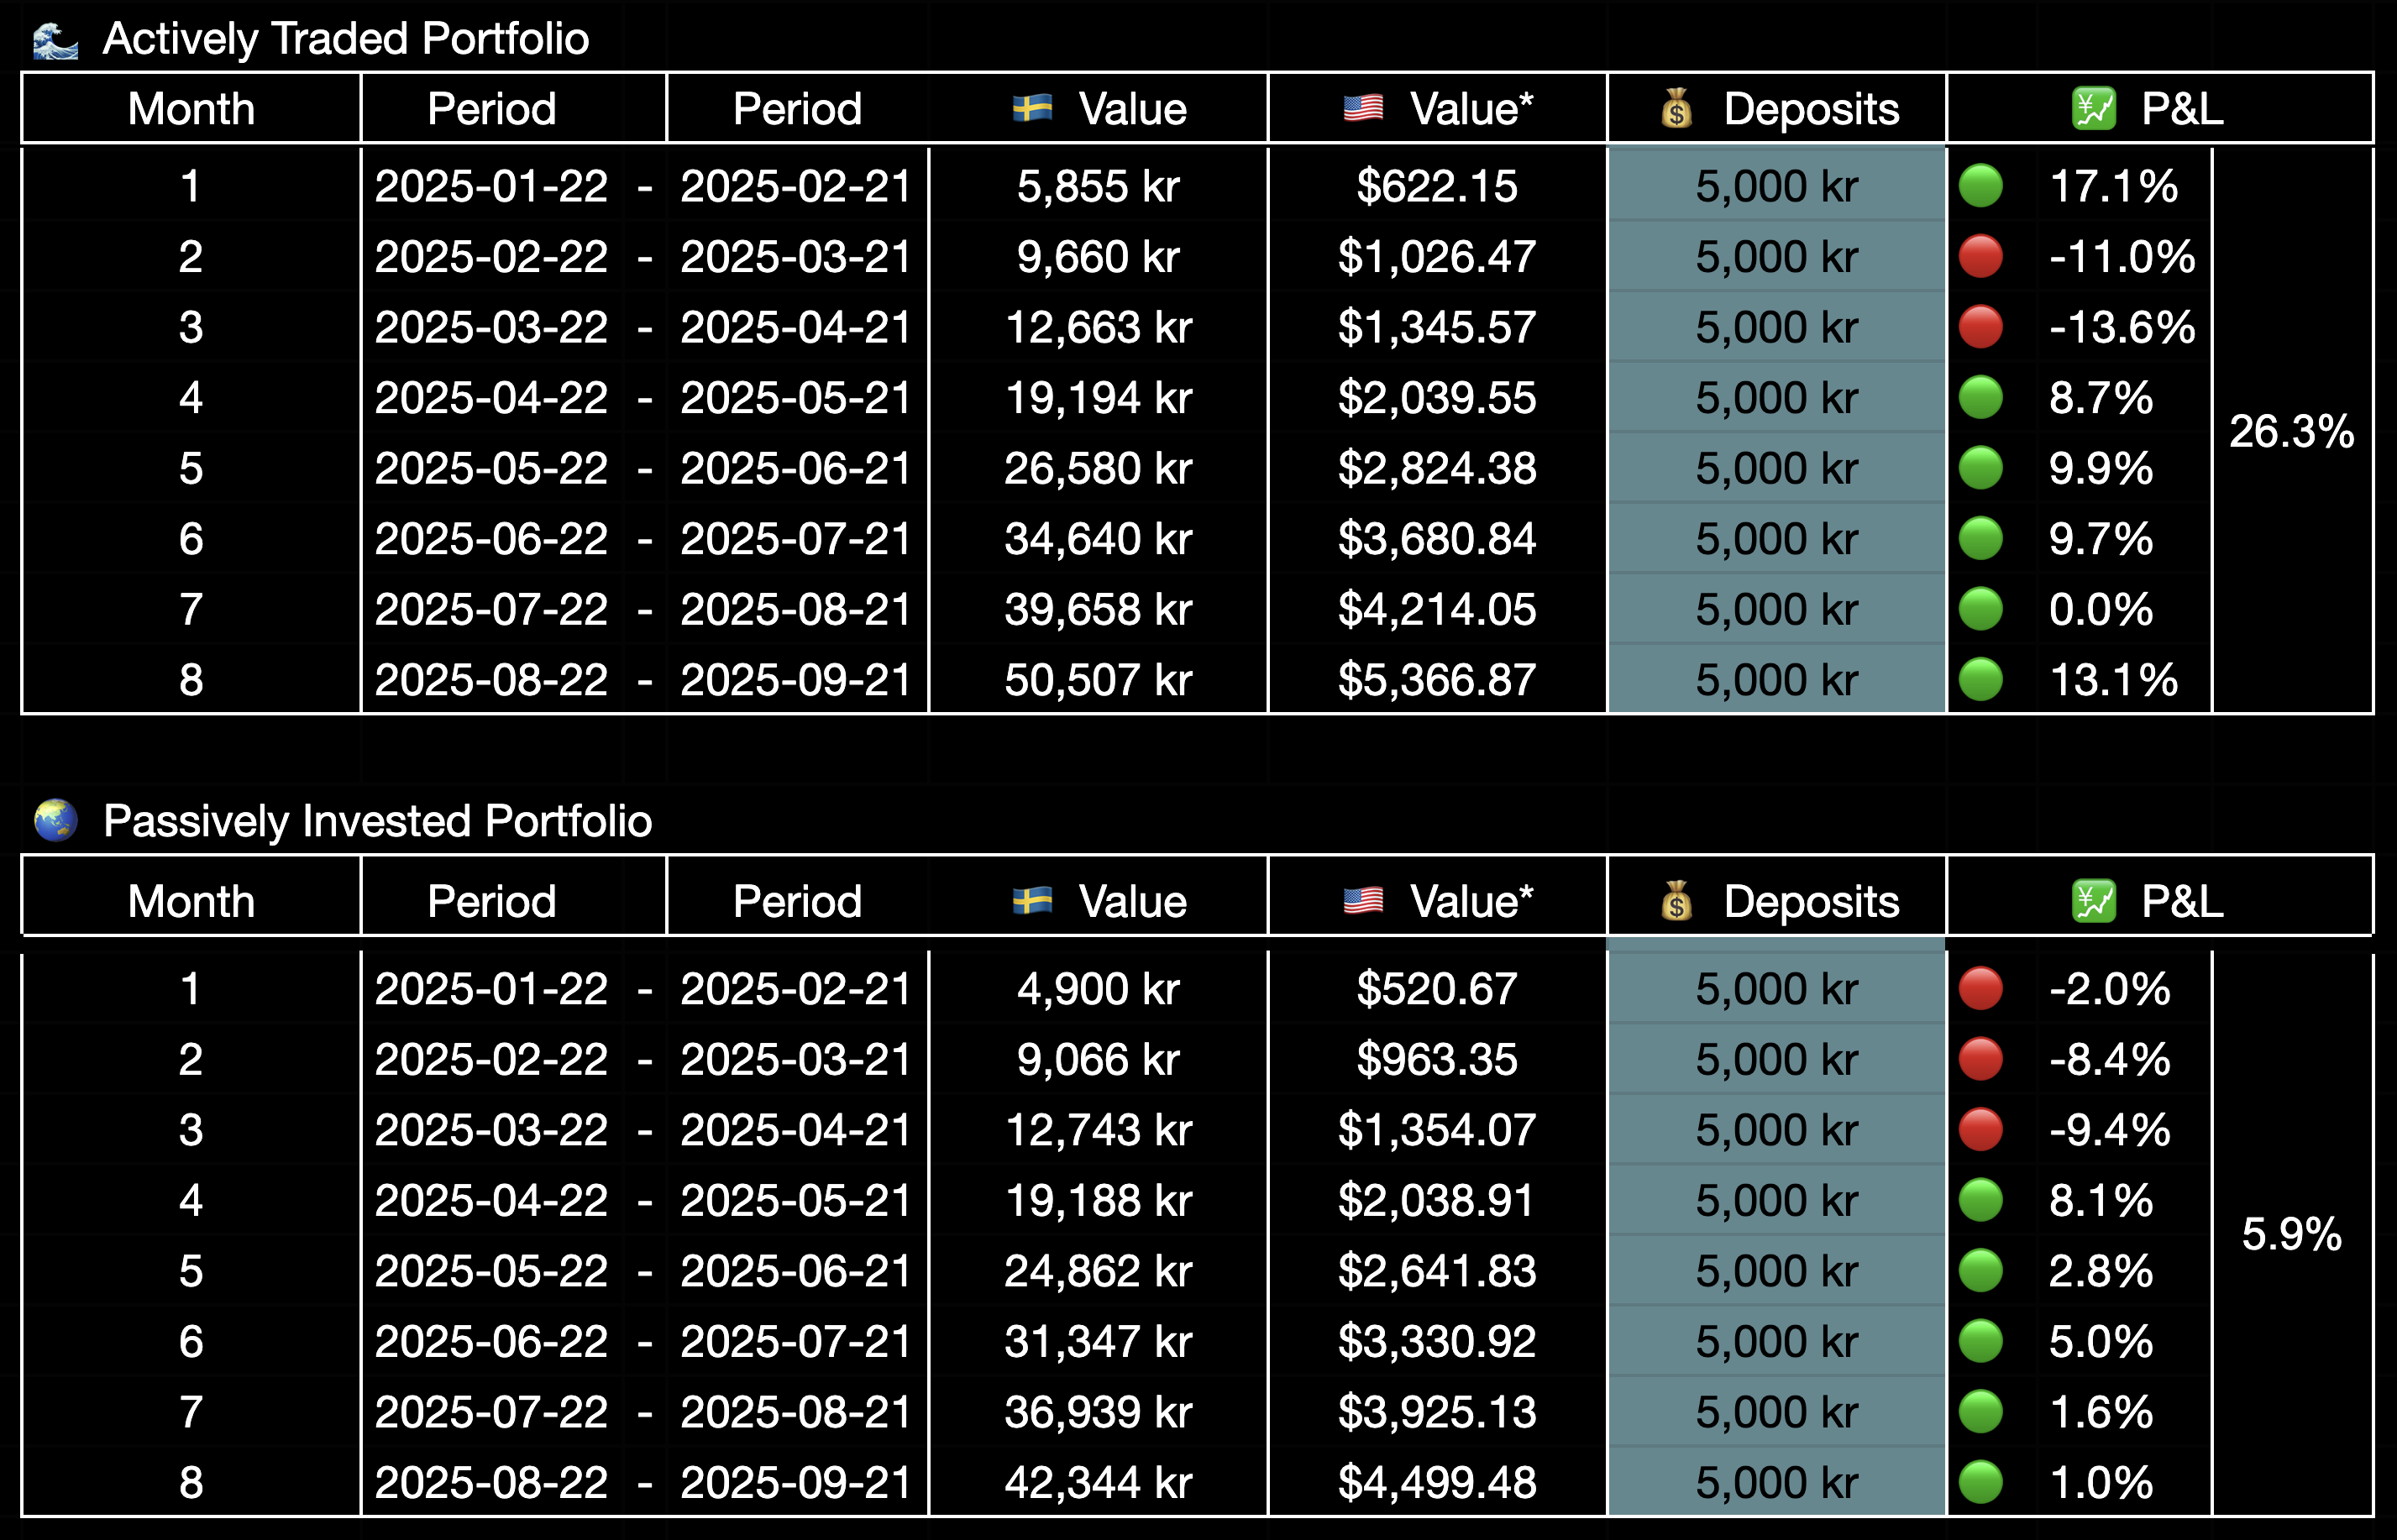
- Actively Traded Portfolio: 🟢 +26.3%
- Passively Invested Portfolio: 🟢 5.9%
 Performance: Year to Date
Performance: Month to Month Overview
On a month-to-month perspective, the Actively Traded Portfolio has outperformed the Passively Invested Portfolio 5 out of 7 months, or 70% of the time.
The Actively Traded Portfolio performance has been flat due to a significant drawdown on my new $NOVO trade, whereas the Passively Invested Portfolio has outperformed with a total of 1.6% gain.
 Performance: Month by Month, Table
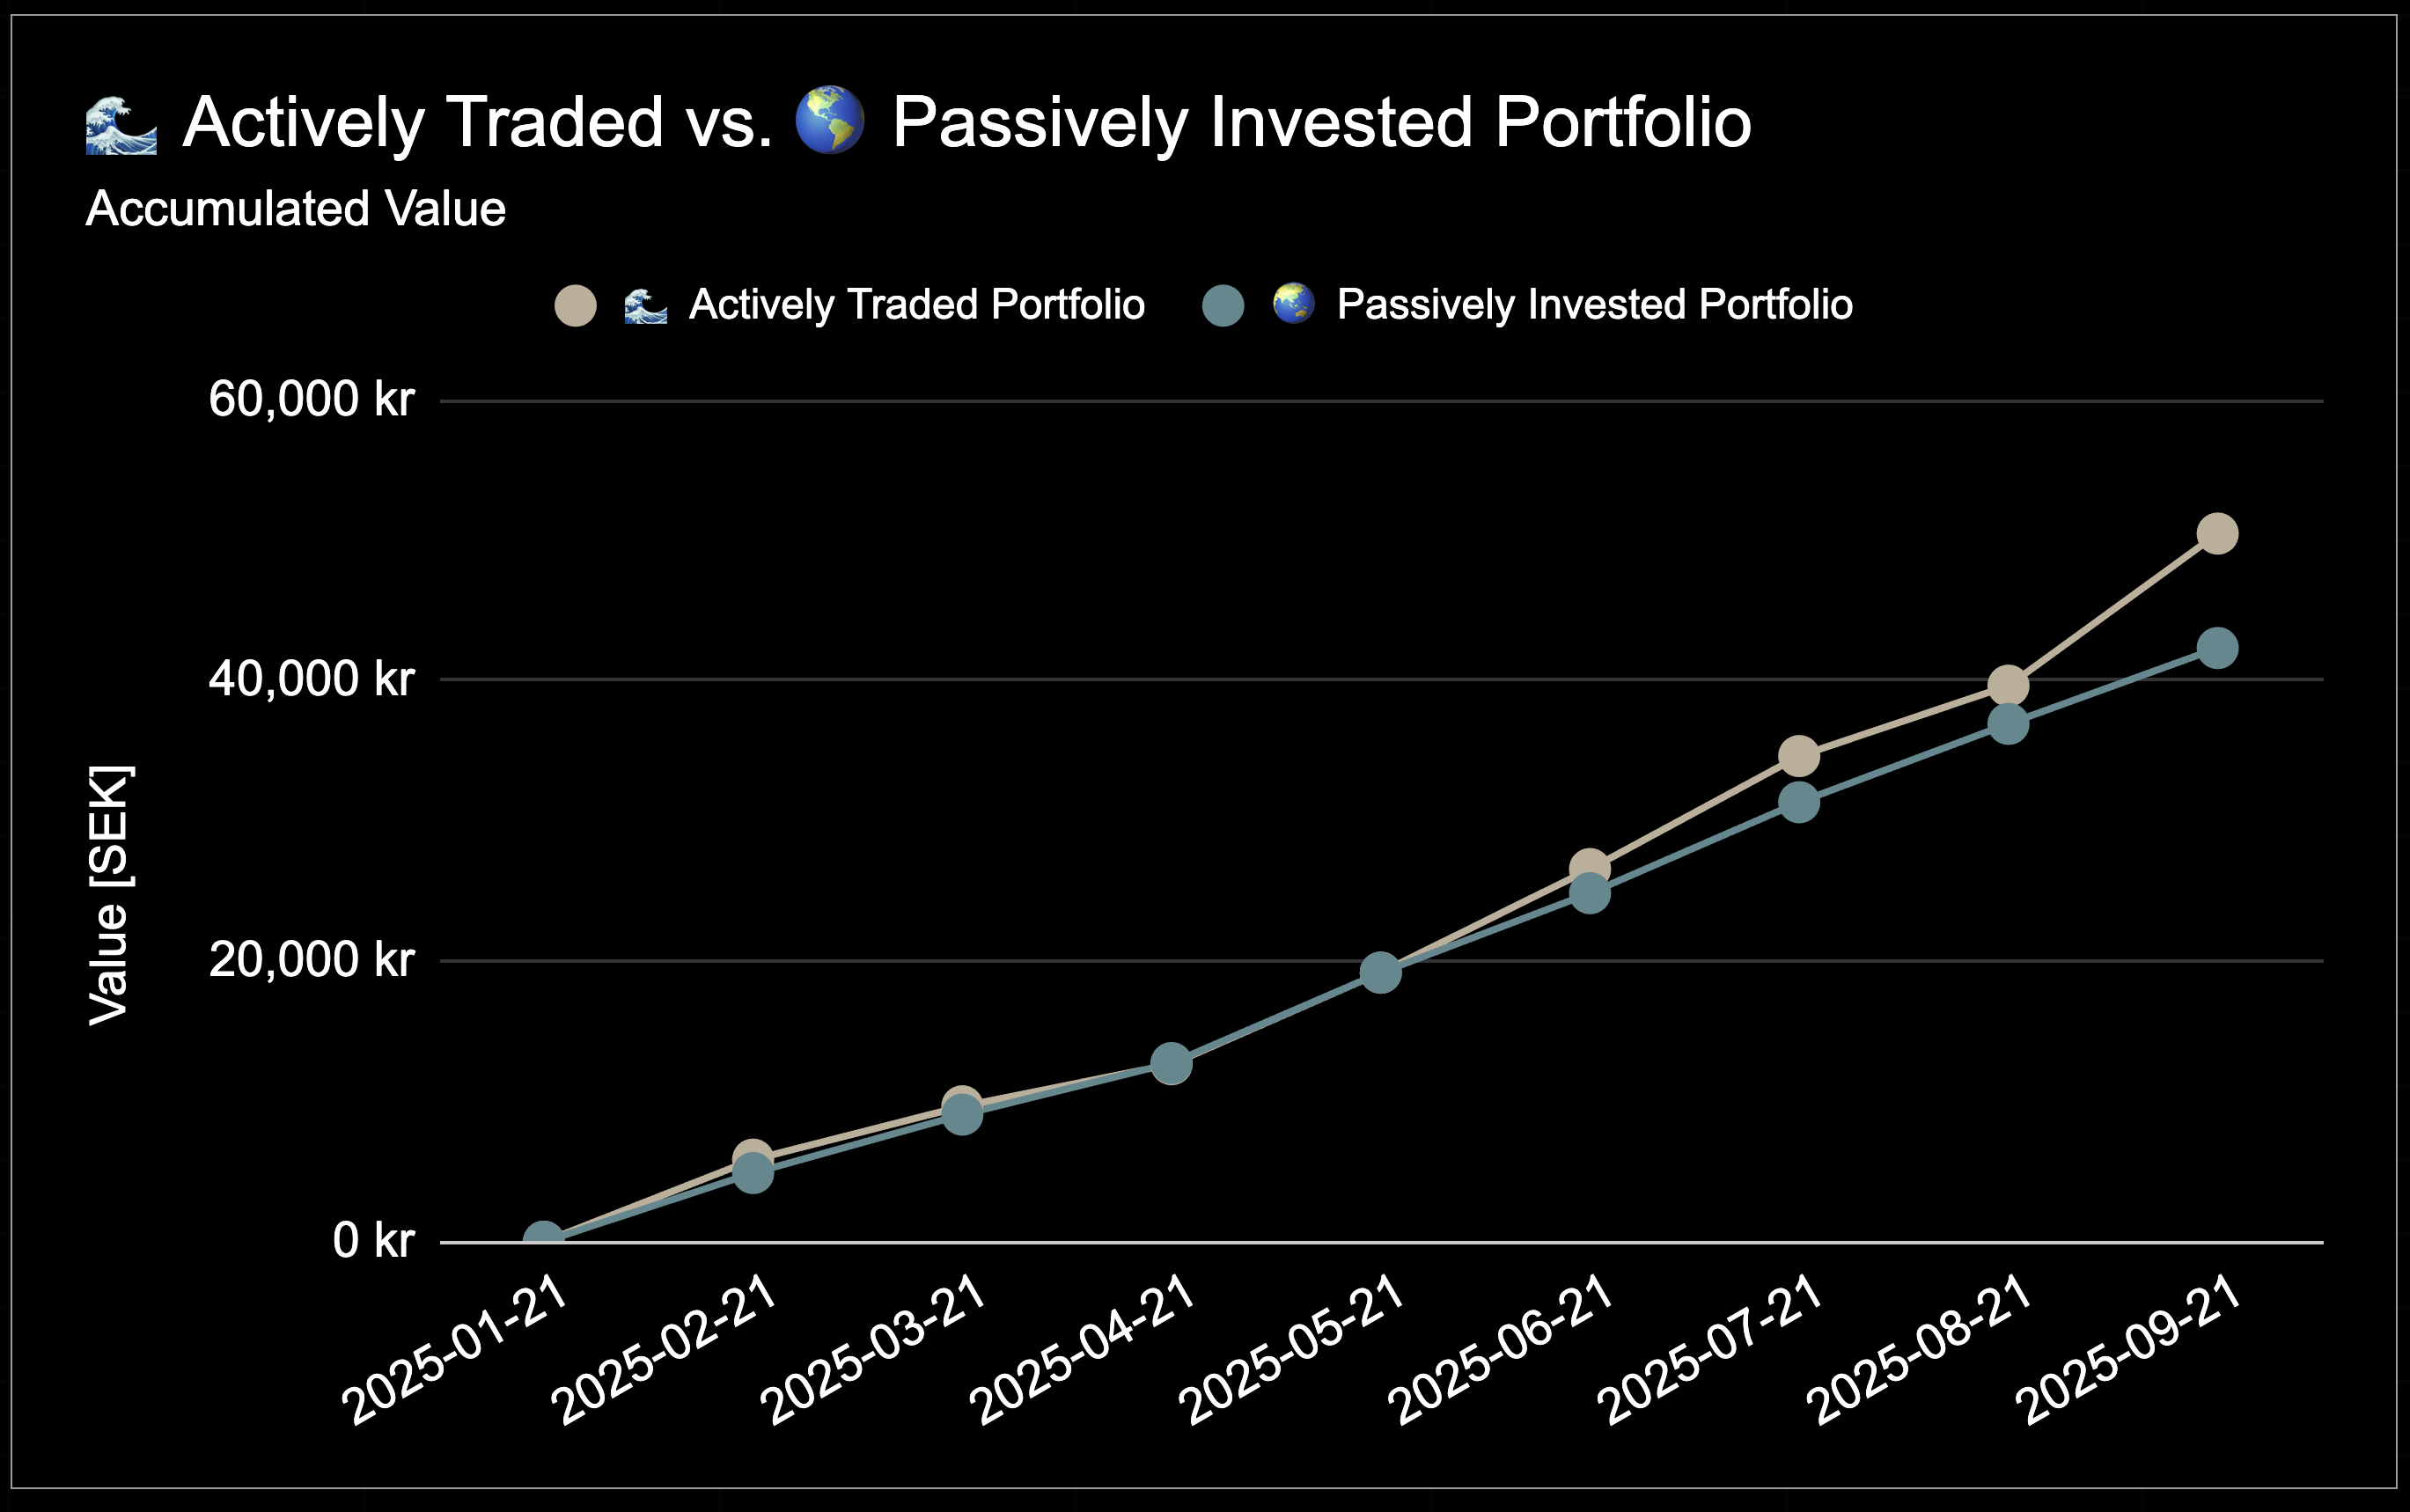 Performance: Month by Month, Chart
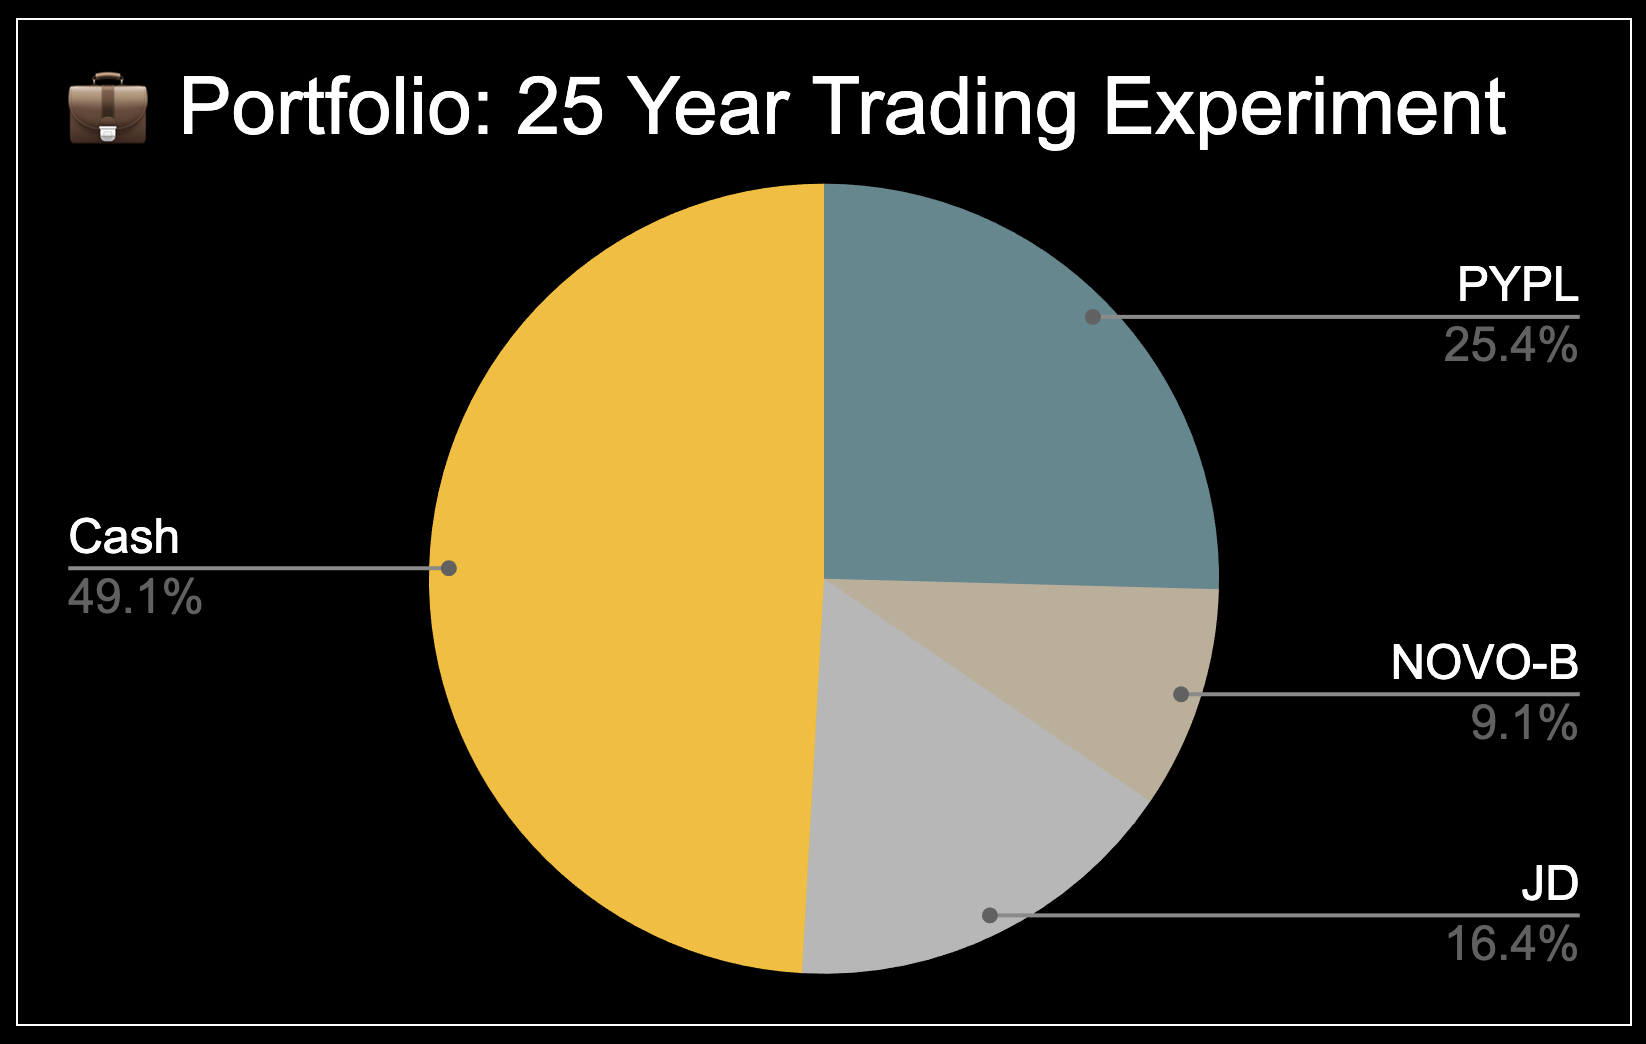
Open Positions
The portfolio currently consists of 3 open positions: $PYPL, $NOVO and $JD.
 Open Positions
The total risk of invested capital is currently ⚠️ 17% with a range of risk per trade from 5% to 6%.
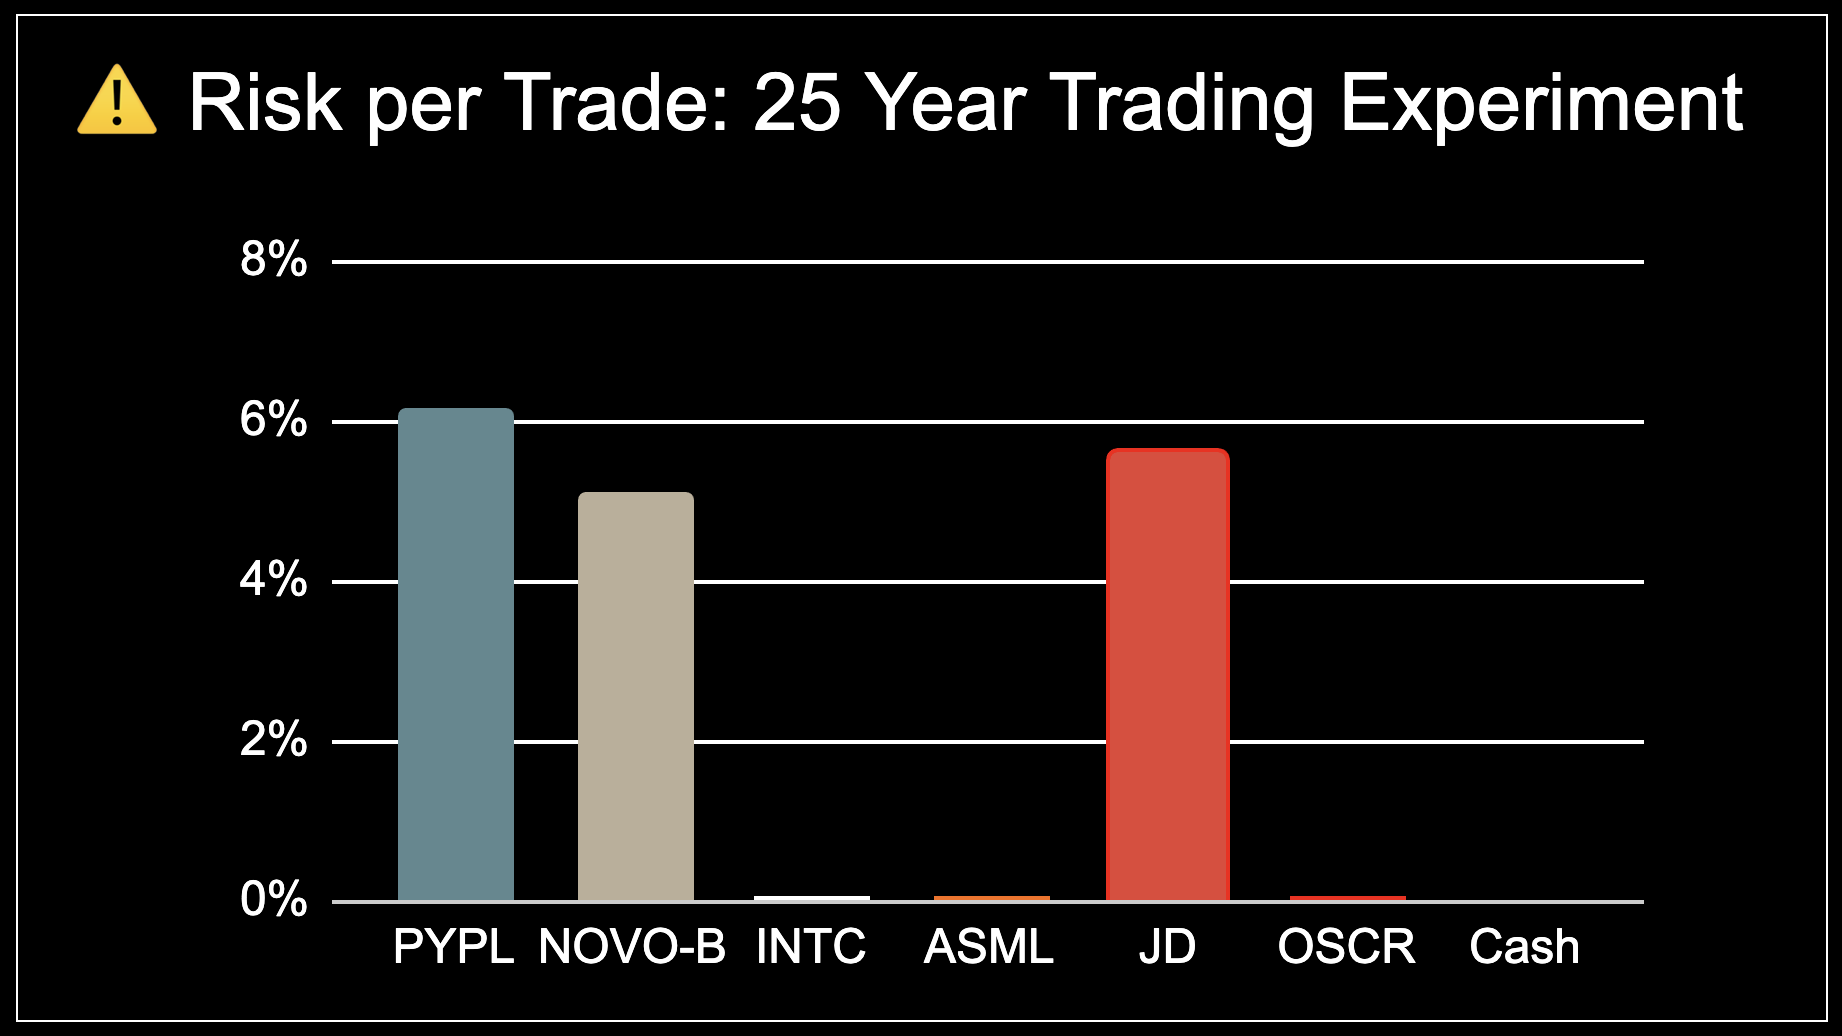 Risk per Trade
Open Positions: Detailed Overview
The following table contains the entry, stop loss, position size, and current market prices.
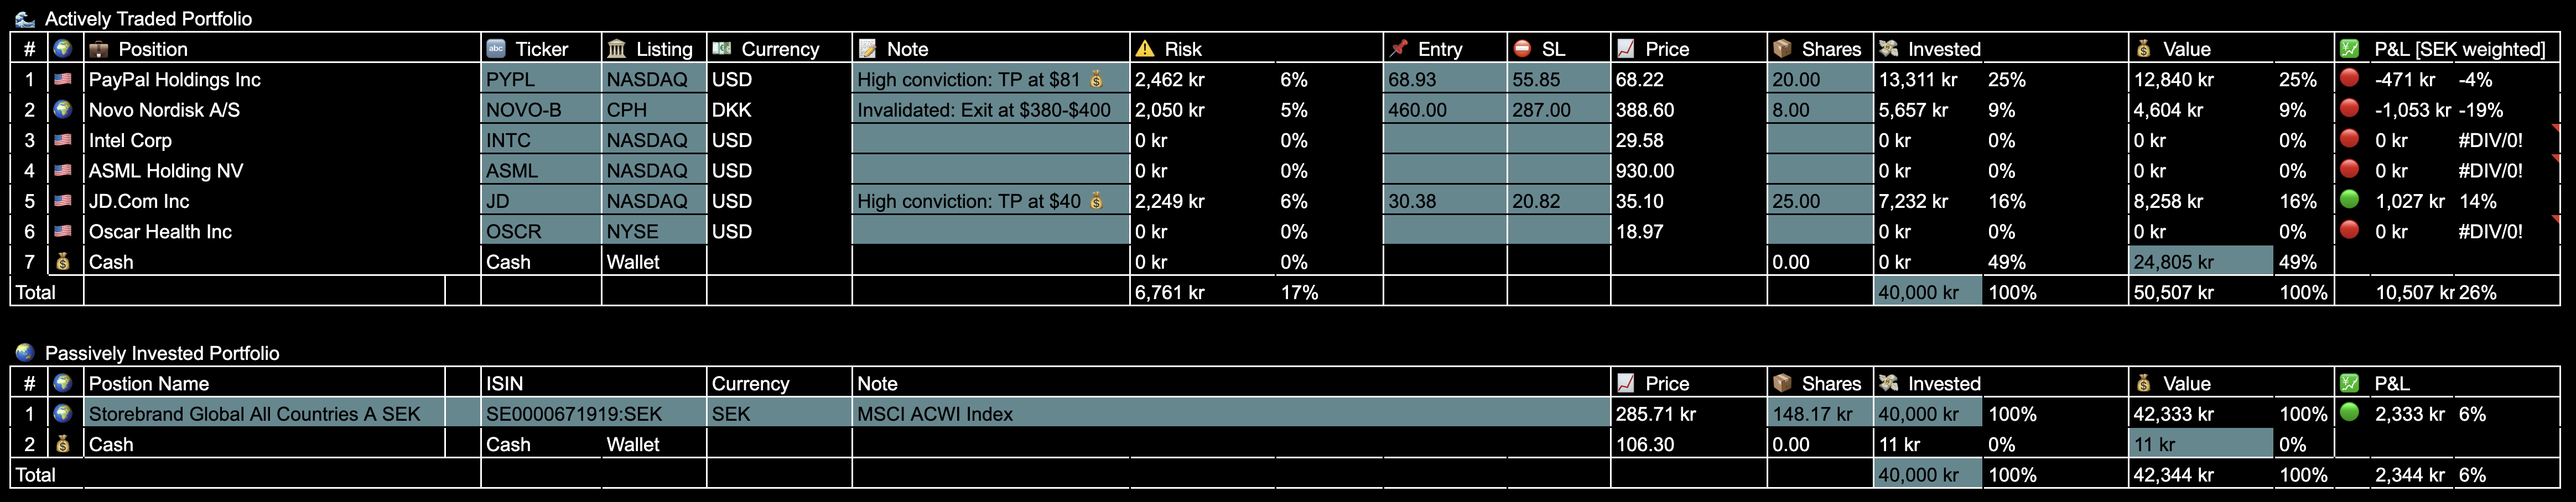 Open Trade: Details
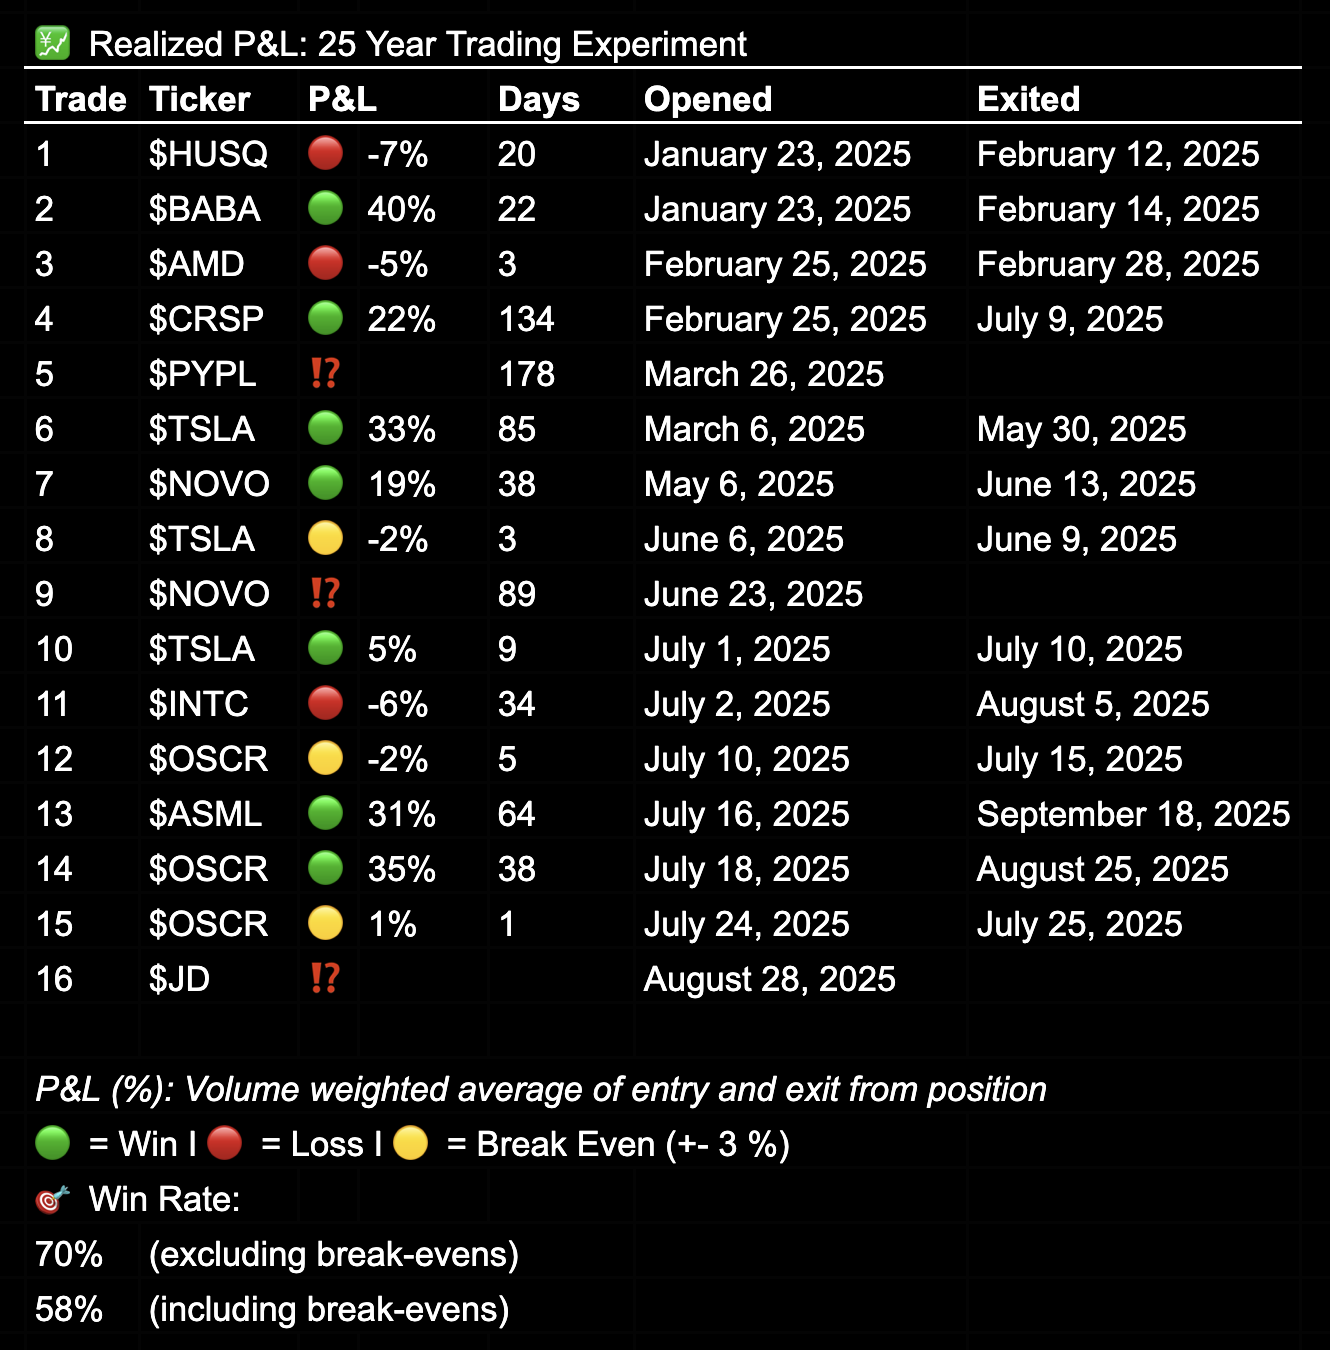
Realized P&L & Win Rate
Since inception, I have realized 13 trades:
- 🟢 7 Winners
- 🔴 3 Losses
- 🟡 3 Break-even (+- 3%)
This translates to a 70% win rate when excluding break-even trades, or 58% including them. The top three trades percentage-wise have been $BABA, $TSLA $OSCR, each delivering between 31% and 40% from entry to exit. Losses have been modest, with a maximum realized loss of just 7.2%.
Realized P&L
25 Year Trading Experiment
For a full overview of the experiment’s purpose and structure, check out my First Post from January 2025, or watch the previously released YouTube introduction.
In short:
- 💰 10,000 SEK (~$1000) invested monthly - split 50/50
- 🌊 Actively Traded vs 🌍 Passively Invested Global Index Fund
- 📅 Contributions on the 22nd of every month.
- 🕰 Tracking my performance from 2025 to 2050.
- 🌐 Transparency: Every trade shared publicly.
Summary
September has been the best month since starting this experiment, and I was also able to exit my best trade in terms of realized P&L on $ASML The portfolio is just closing in on a total of $10,000 with an aggregated portfolio performance year-to-date of 16.1%. But at the same time, I made some mistakes this month. I missed to enter a high conviction trade on $BIDU as well as messed it up on one of my trades for $INTC. In general, it actually could have been better, but in the end, I’m still very happy with the performance and the process of becoming a better trader on a day-to-day basis.
How are you tracking your trading performance?
💬 Share your thoughts on X or Substack — I’m always interested in connecting with like-minded people.