💼 Portfolio Update: 25 Year Trading Experiment | November 2025

Markets are red, and after six months of positive P&L outperforming the global index, November turned red. Let’s break down the performance of the past 300 days and how November price action corrected my portfolios.
All trades are always shared live on X.com/tradergu, and the public trading dashboard is updated with the latest trade details and up-to-date portfolio allocations.
Performance: Year to Date
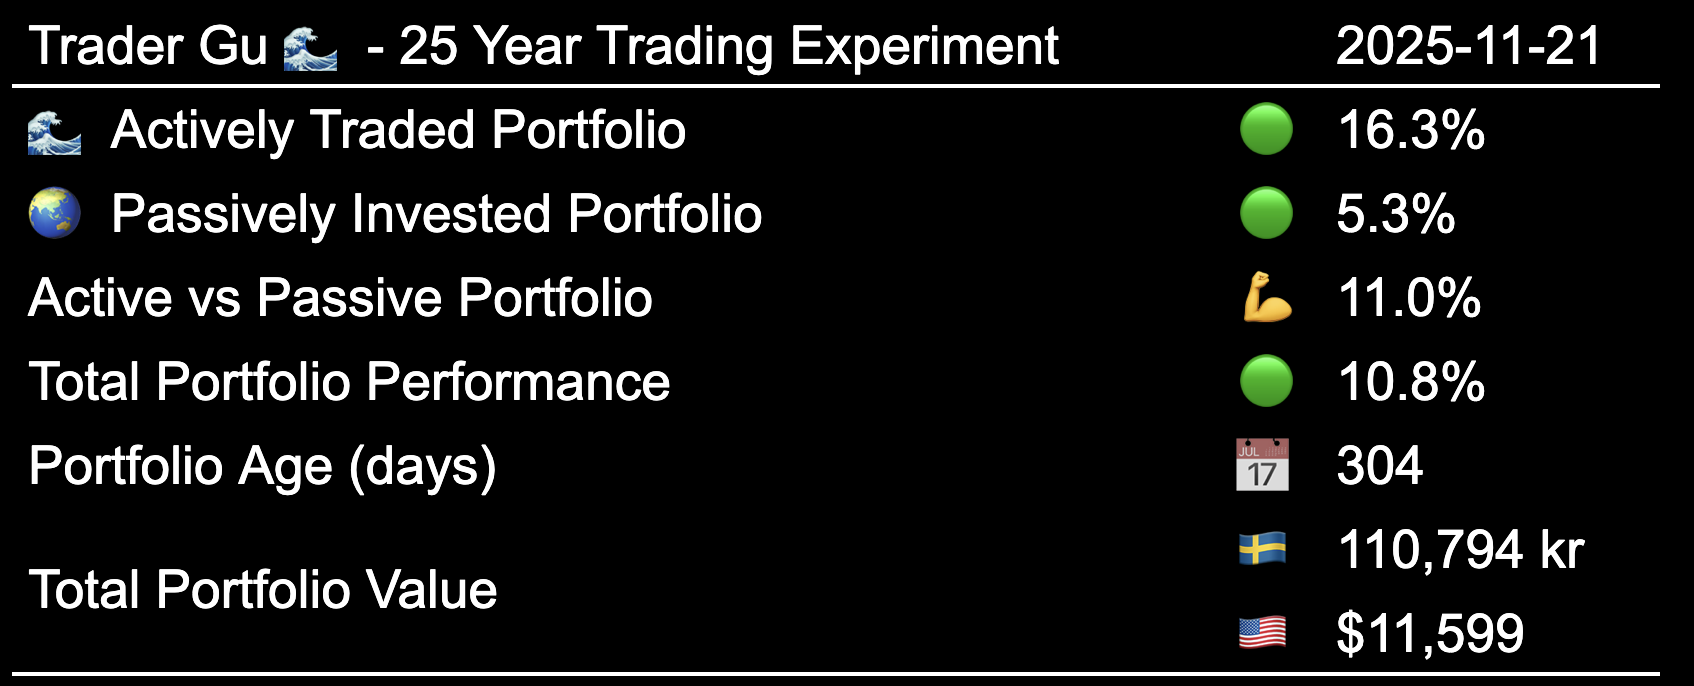
The total portfolio value is now above $11,600. Both portfolios are in profit, and the Actively Traded Portfolio has outperformed the Passively Invested Portfolio by 11 percentage points year-to-date 💪.
- Actively Traded Portfolio: 🟢 +16.3%
- Passively Invested Portfolio: 🟢 +5.3%
 Performance: Year to Date
Performance: Month to Month Overview
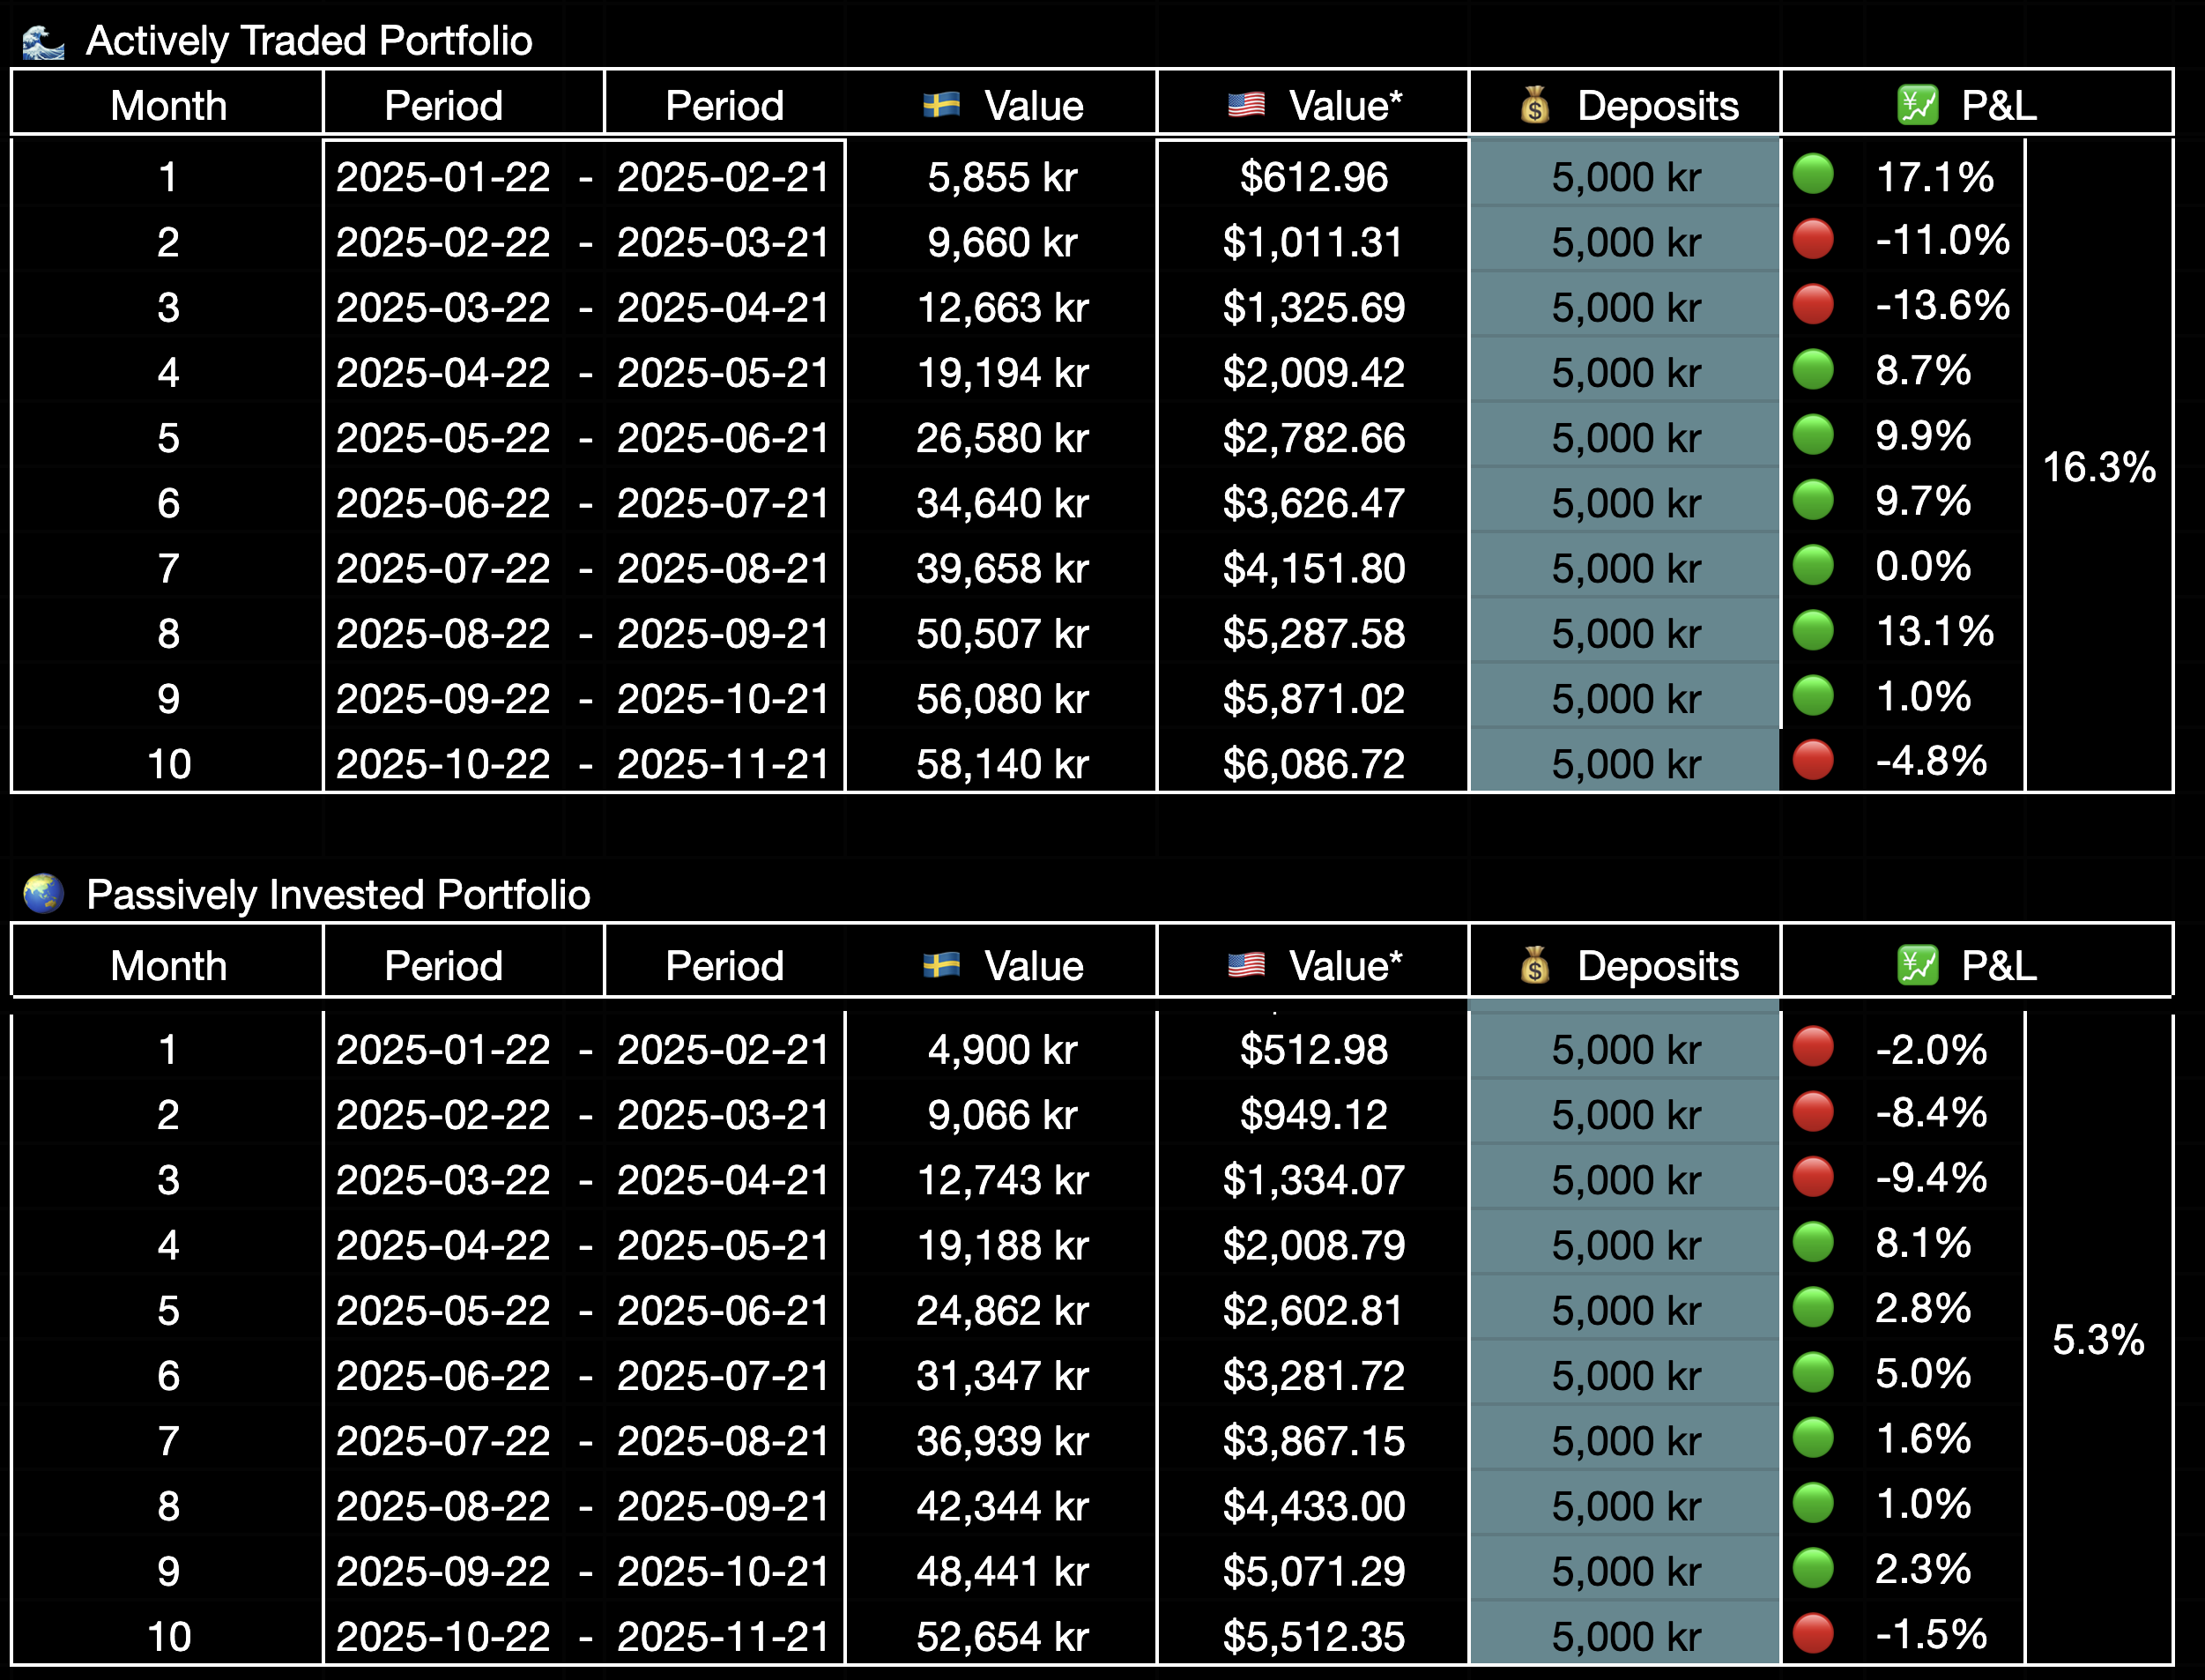
On a month-to-month basis, the Actively Traded Portfolio has outperformed the Passively Invested Portfolio 50% of the time with a higher volatility in both directions. Currently the profits are 3x higher for the Actively Traded Account.
For November, the Actively Traded Account had a significant drawback with unrealized loss of -4.8%, while the Passively Invested Portfolio corrected -1,5%.
 Performance: Month by Month, Table
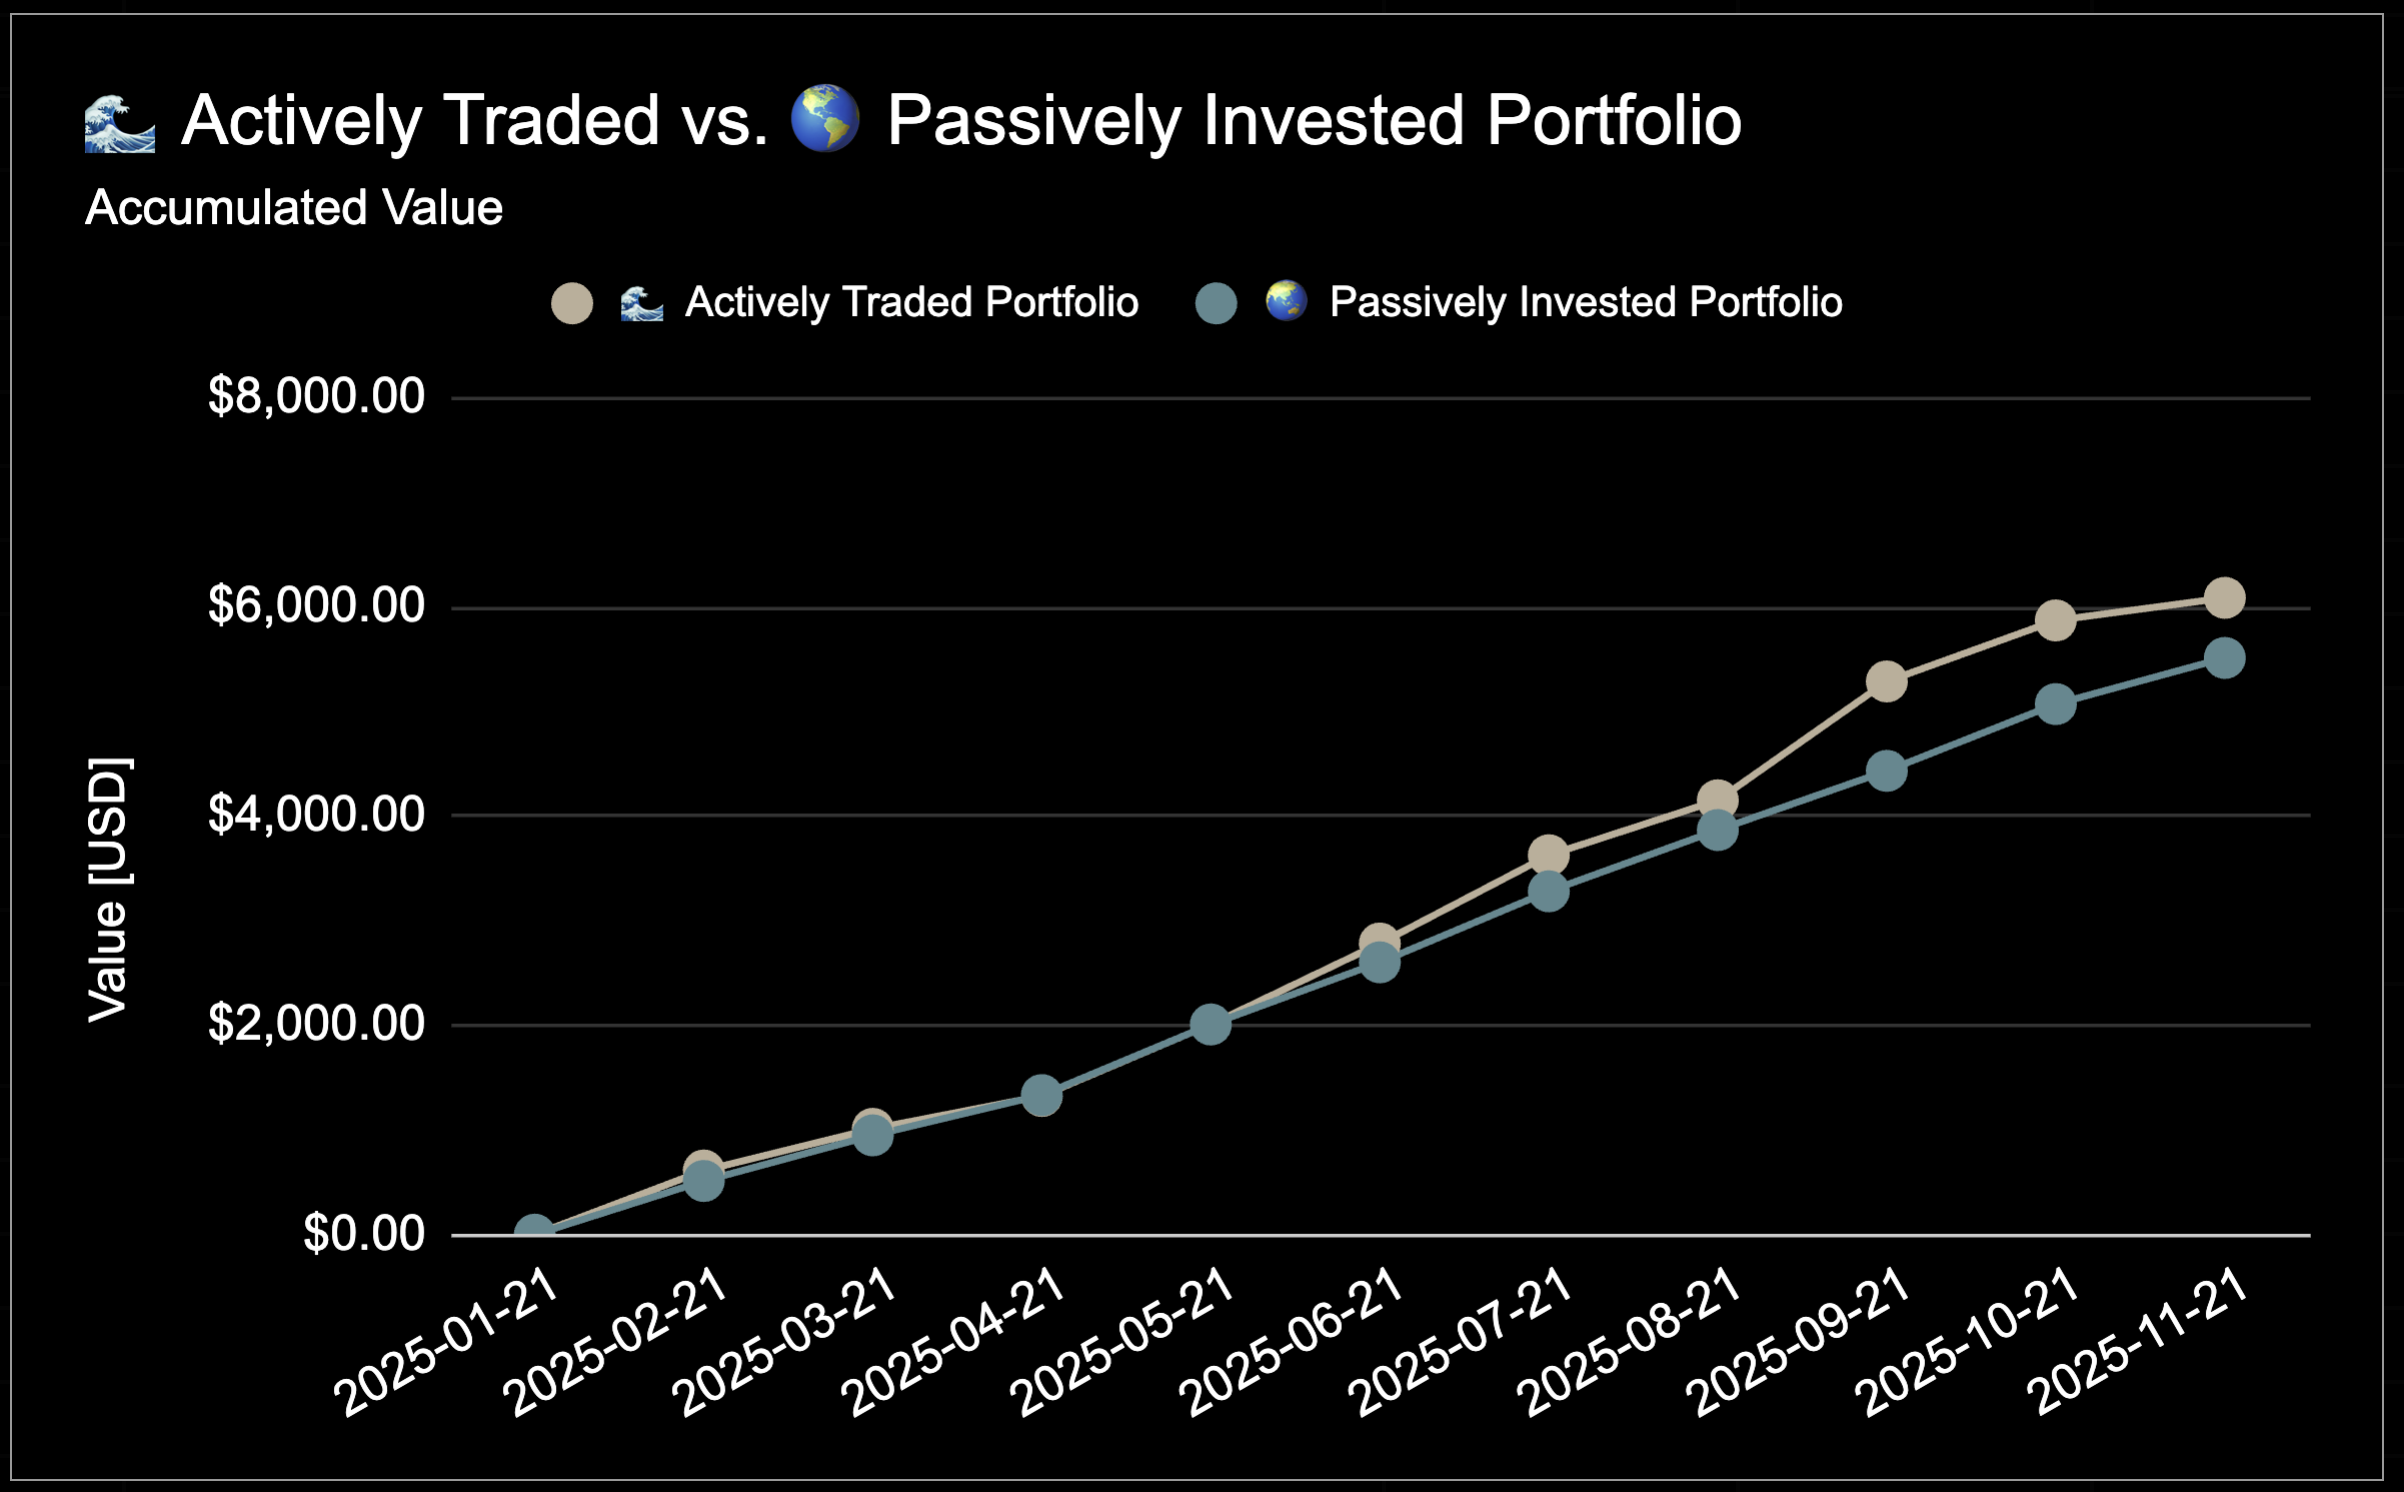 Performance: Month by Month, Chart
Open Positions
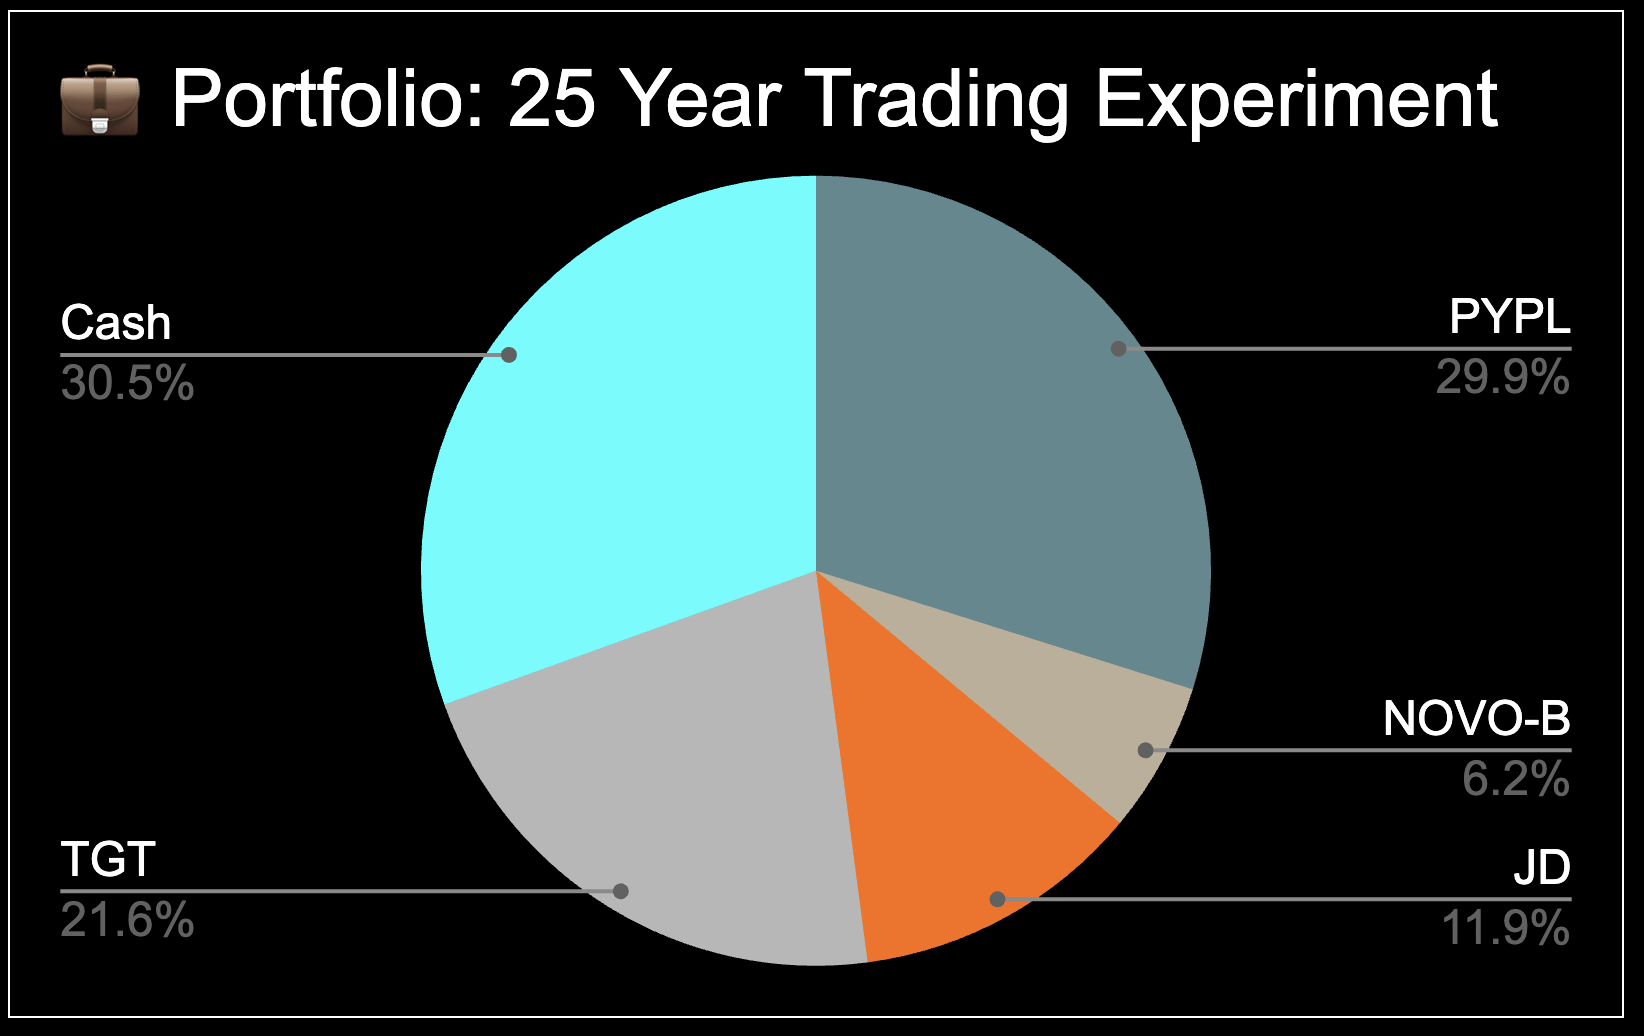
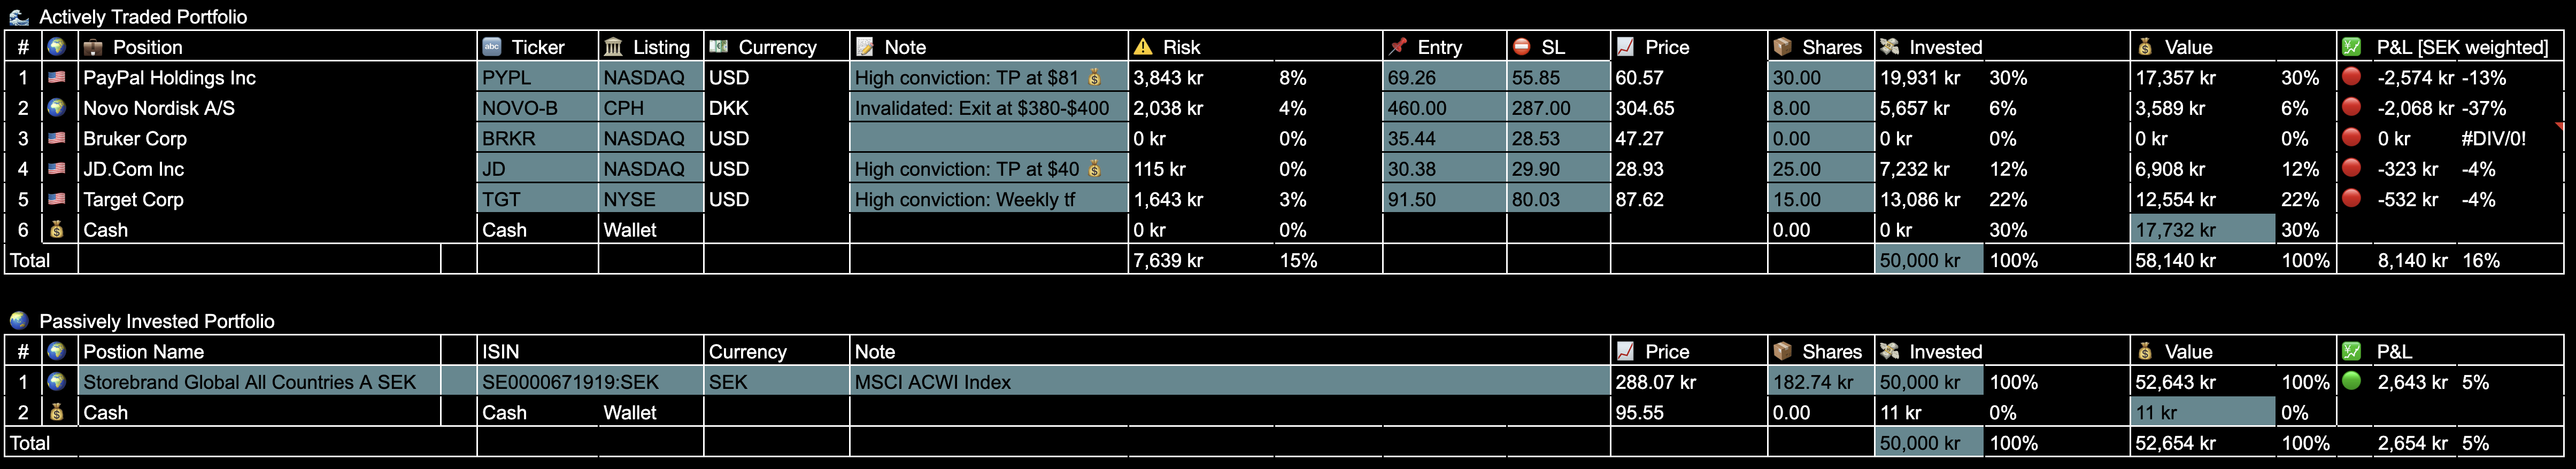
The portfolio currently consists of four open positions: $PYPL, $NOVO, $JD, and the latest addition, $TGT.
 Open Positions
The total invested capital at risk is currently ⚠️ 15%, with the highest per-trade risk being 8% on $PYPL.
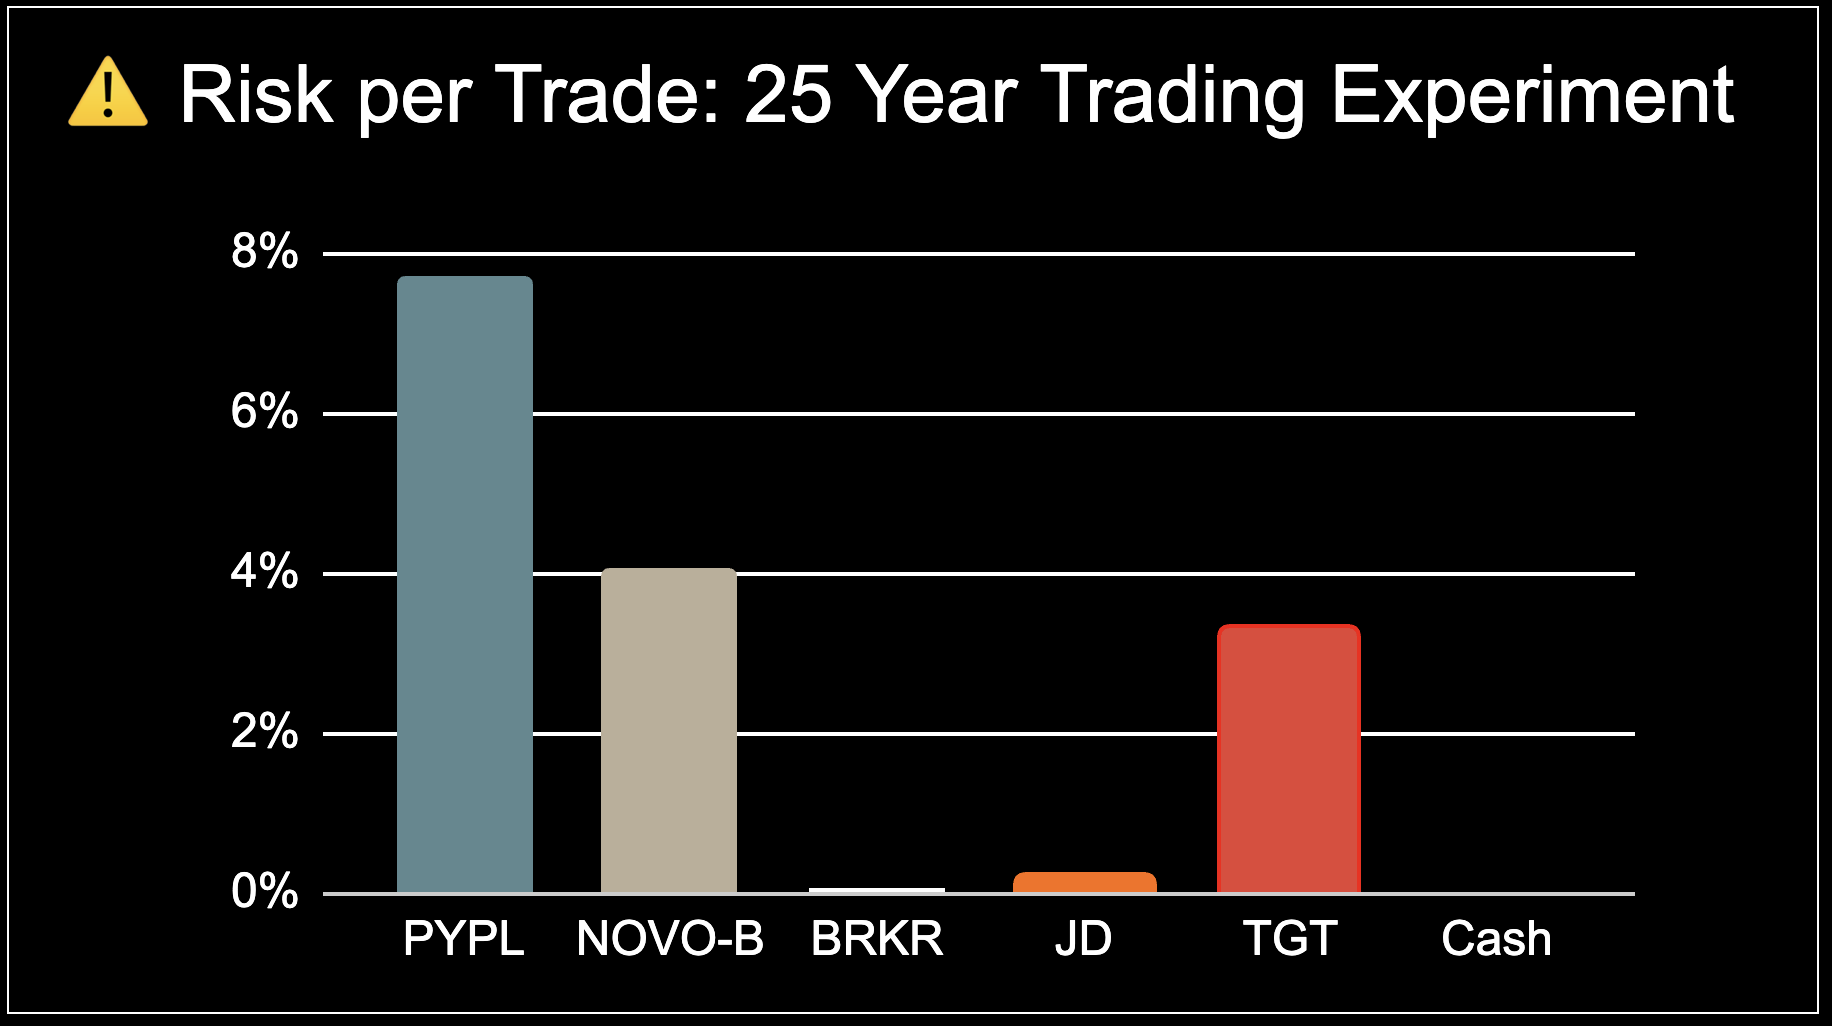 Risk per Trade
Open Positions: Detailed Overview
The following table contains the entry, stop loss, position size, and current market prices.
 Open Trades: Details
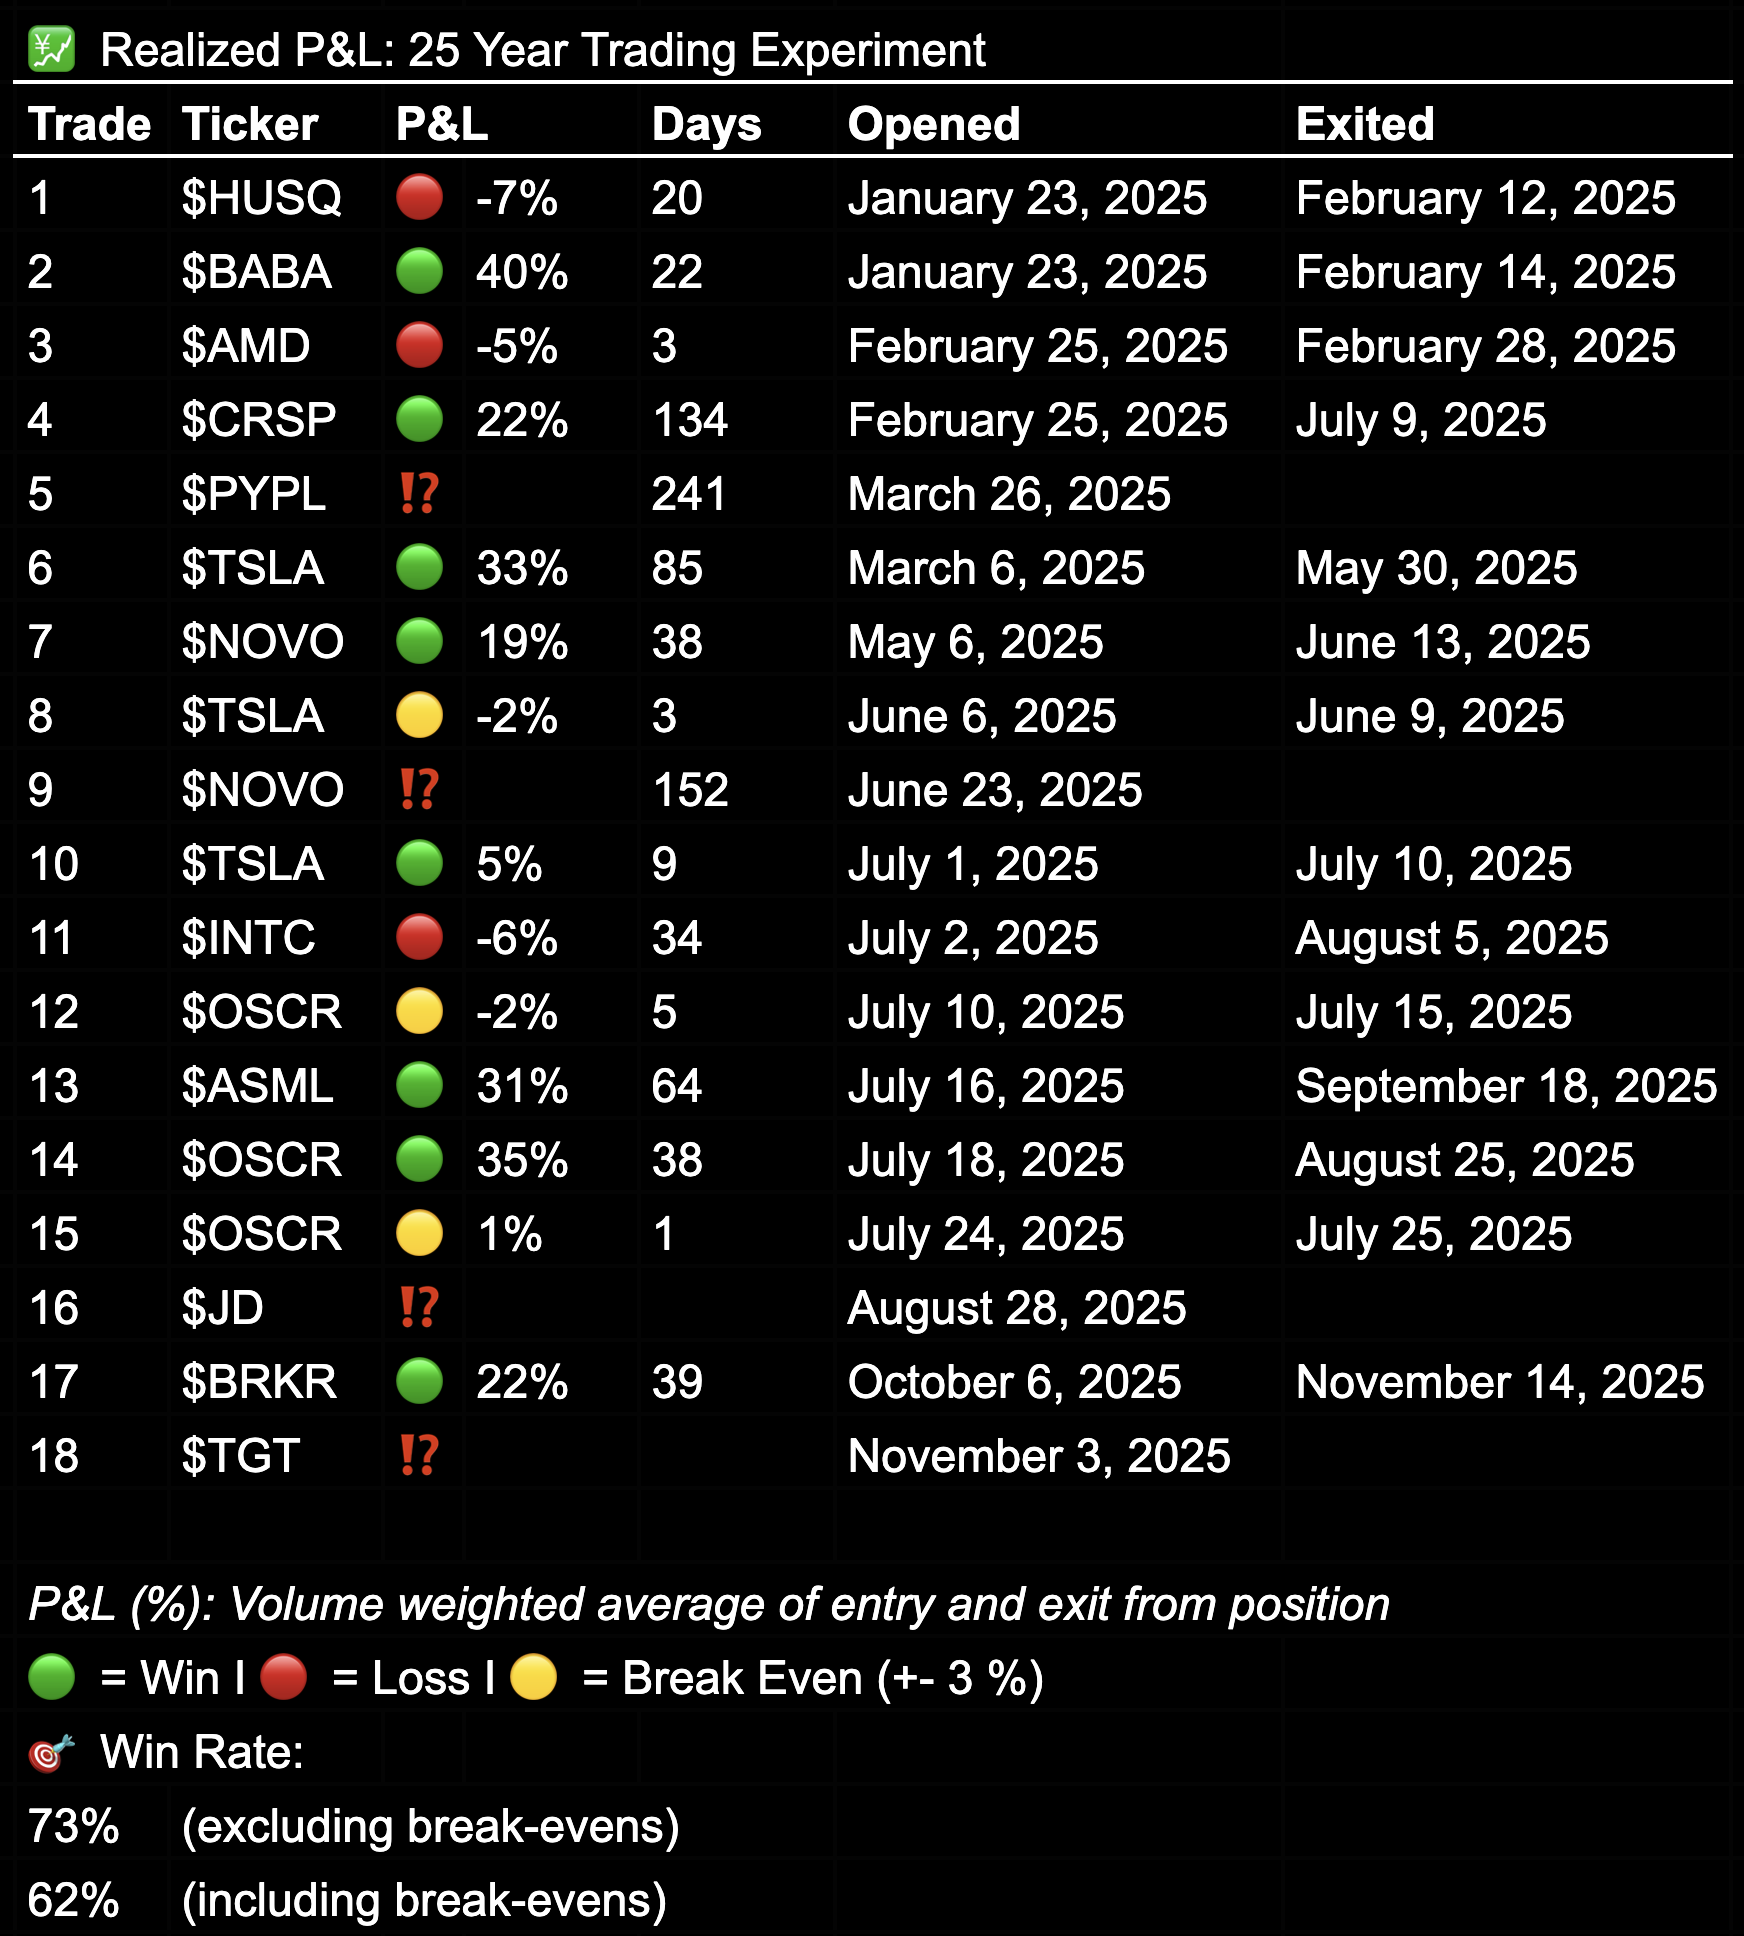
Realized P&L & Win Rate
Since inception, I have realized 13 trades:
- 🟢 8 Winners
- 🔴 3 Losses
- 🟡 3 Break-even (+/- 3%)
This translates to a 73% win rate when excluding break-even trades, or 62% including them. The top three trades, percentage-wise, have been $BABA, $TSLA, and $OSCR, each delivering between 31% and 40% from entry to exit.
Realized losses have so far been modest, with a maximum realized loss of just 7.2%. These results will change once I start realizing profit and loss for the open invalidated positions such as a massive drawback in a $NVO trade.
 Realized P&L
25 Year Trading Experiment
For a full overview of the experiment’s purpose and structure, check out my First Post from January 2025, or watch the previously released YouTube introduction.
In short:
- 💰 10,000 SEK (~$1,000) invested monthly – split 50/50
- 🌊 Actively Traded vs 🌍 Passively Invested Global Index Fund
- 📅 Contributions on the 22nd of every month
- 🕰 Tracking my performance from 2025 to 2050
- 🌐 Transparency: Every trade shared publicly
Summary
A volatile month to say the least. Realizing good profits in $BRKR trade, 22% gain on position for a high conviction trade which might have been closed too soon. Time will tell and I walked through the trade in a recent in-depth trade review.
However, my current high-conviction trades are showing a bearish market structure reversals on the weekly time frame and if that propagates to the monthly - realized losses will increase sharply coming months as $NOVO, $PYPL and $JD are currently putting pressure on my portfolio.
Cash position is strong, 30% with new monthly deposits on it’s way. Looking forward I feel confident but humbled and try to always rememer the long-term goal of this experiment.
How are you tracking your trading performance?
💬 Share your thoughts on X or Substack — I’m always interested in connecting with like-minded people.