Portfolio Update: 25 Year Trading Experiment | May 2026
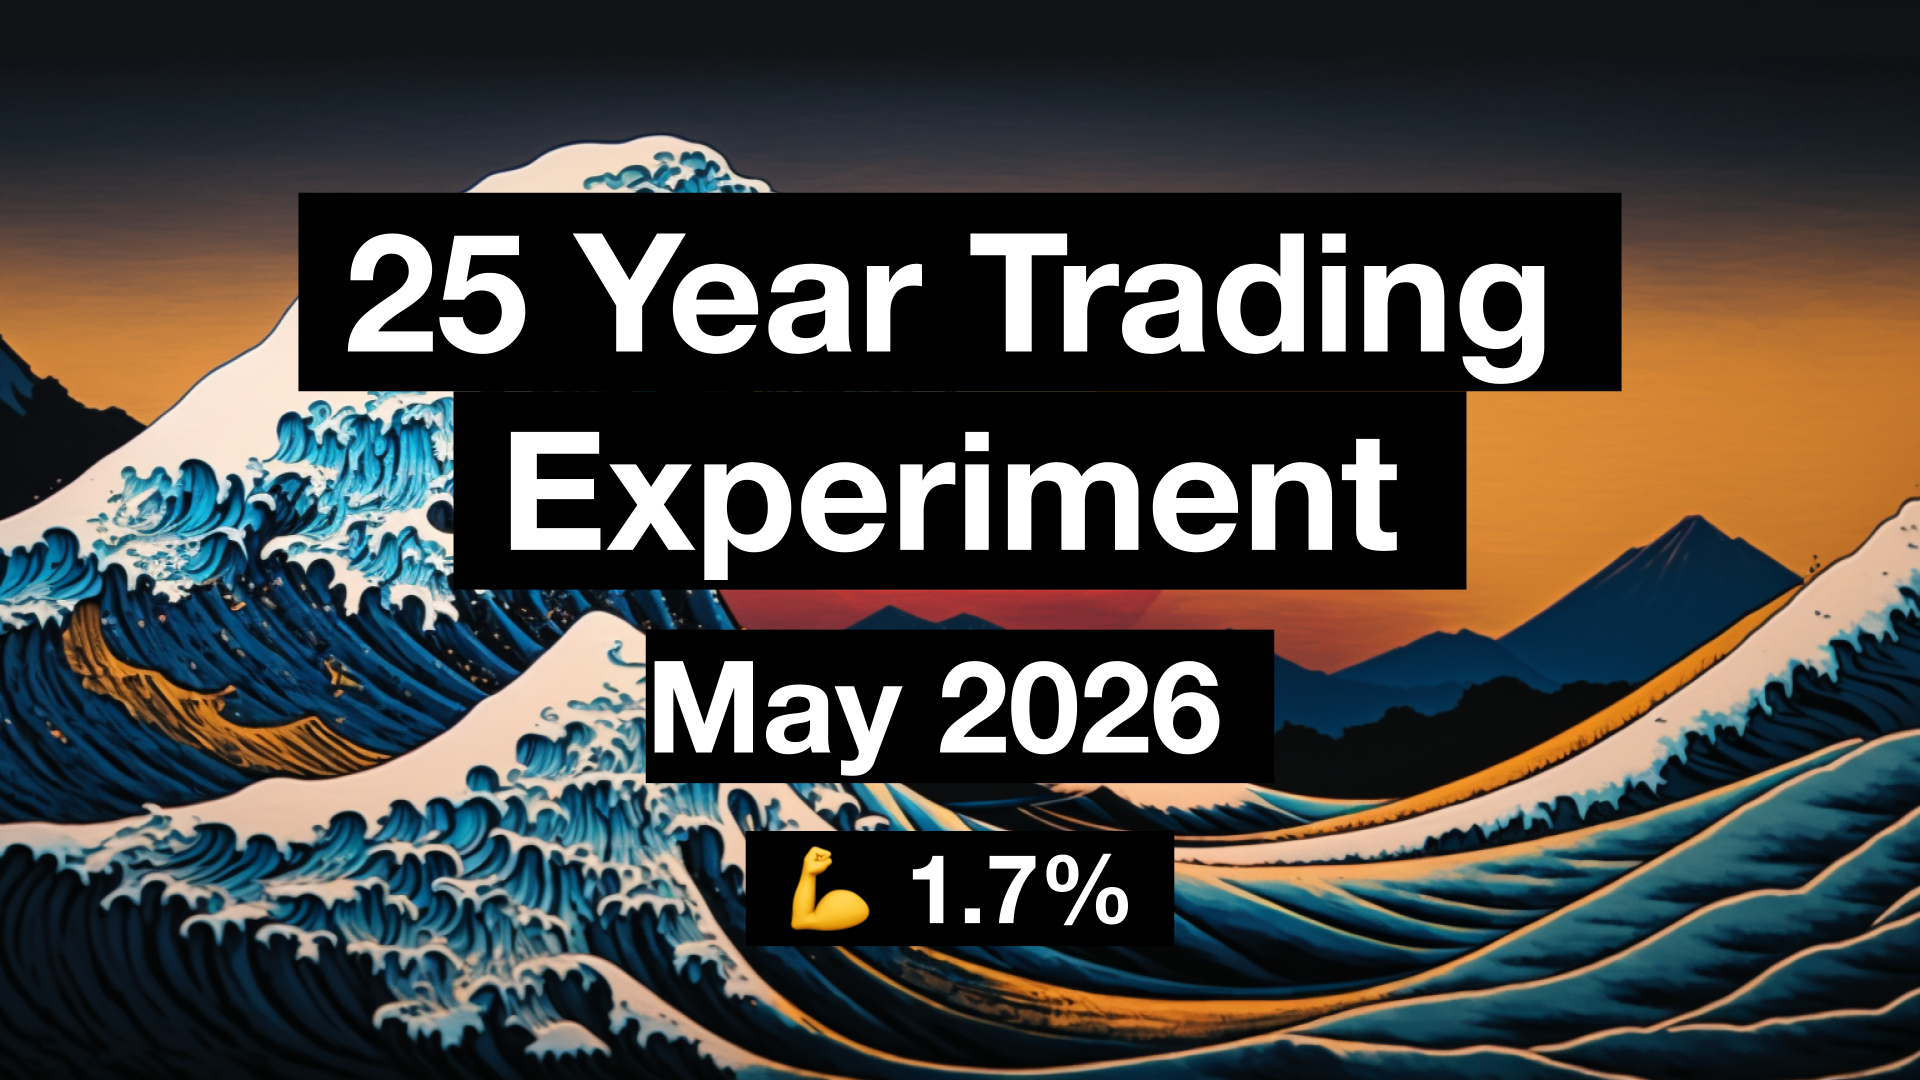
Month 16. The momentum from last month’s recovery carried straight through. Both portfolios posted strong gains, and the actively traded portfolio continues to lead. The active side is now at +17.8% from inception, the passive at +16.1%. No new positions were opened, no exits. The seven open trades are working. Sometimes the best thing you can do is nothing.
All trades are always shared live on X.com/tradergu, and the public trading dashboard is updated with the latest trade details and up-to-date portfolio allocations.
Performance: Inception to Date
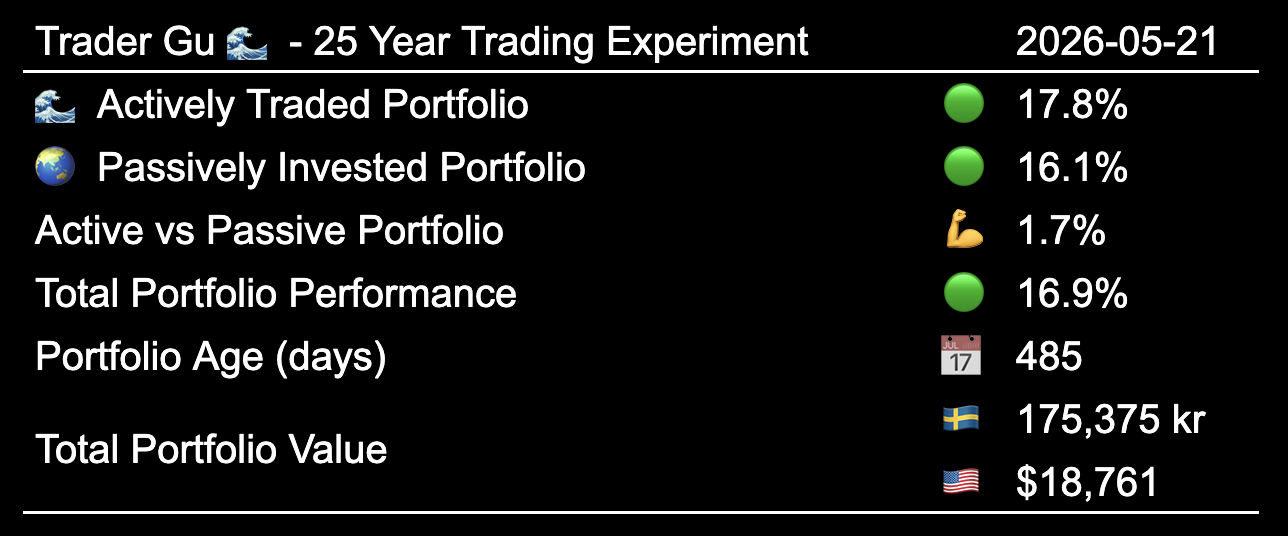
The total portfolio value is now worth $18,761 (175,375 kr). Both portfolios are solidly in profit. The active portfolio has extended its lead slightly from last month’s 1.6 percentage points to 1.7.
- Actively Traded Portfolio: 🟢 +17.8%
- Passively Invested Portfolio: 🟢 +16.1%
 Performance: Inception to Date
The goal is to outperform the global index over a 25 year period through disciplined active Swing Trading.
Performance: Year to Date
The active portfolio is now solidly in the green on a 2026 year-to-date basis at +5.8%, up from +0.4% last month. The passive portfolio also continued its climb, reaching +10.5% year-to-date. The passive side still leads on a YTD basis by 4.7 percentage points. Both portfolios are running. The active side just needs to keep closing the gap month by month.
- Actively Traded Portfolio: 🟢 +5.8%
- Passively Invested Portfolio: 🟢 +10.5%
 Performance: Year to Date
Performance: Month to Month Overview
Month 16 was another strong month for both portfolios. After the active side’s dramatic +13.1% recovery in month 15, the gains continued. Both portfolios tracked closely this month, with the active side gaining slightly more than the passive on an inception-to-date basis.
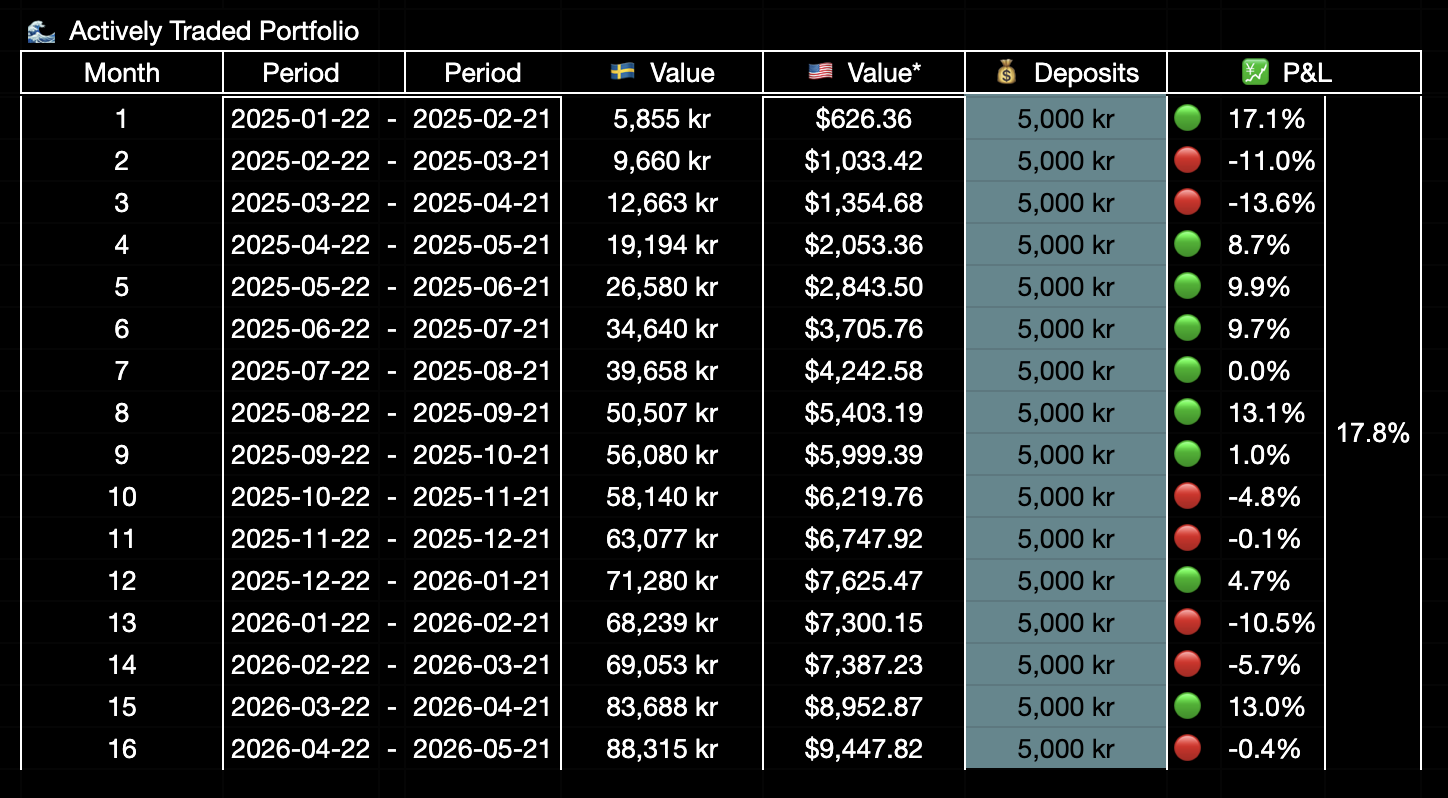 Performance: Month by Month, Actively Traded Portfolio
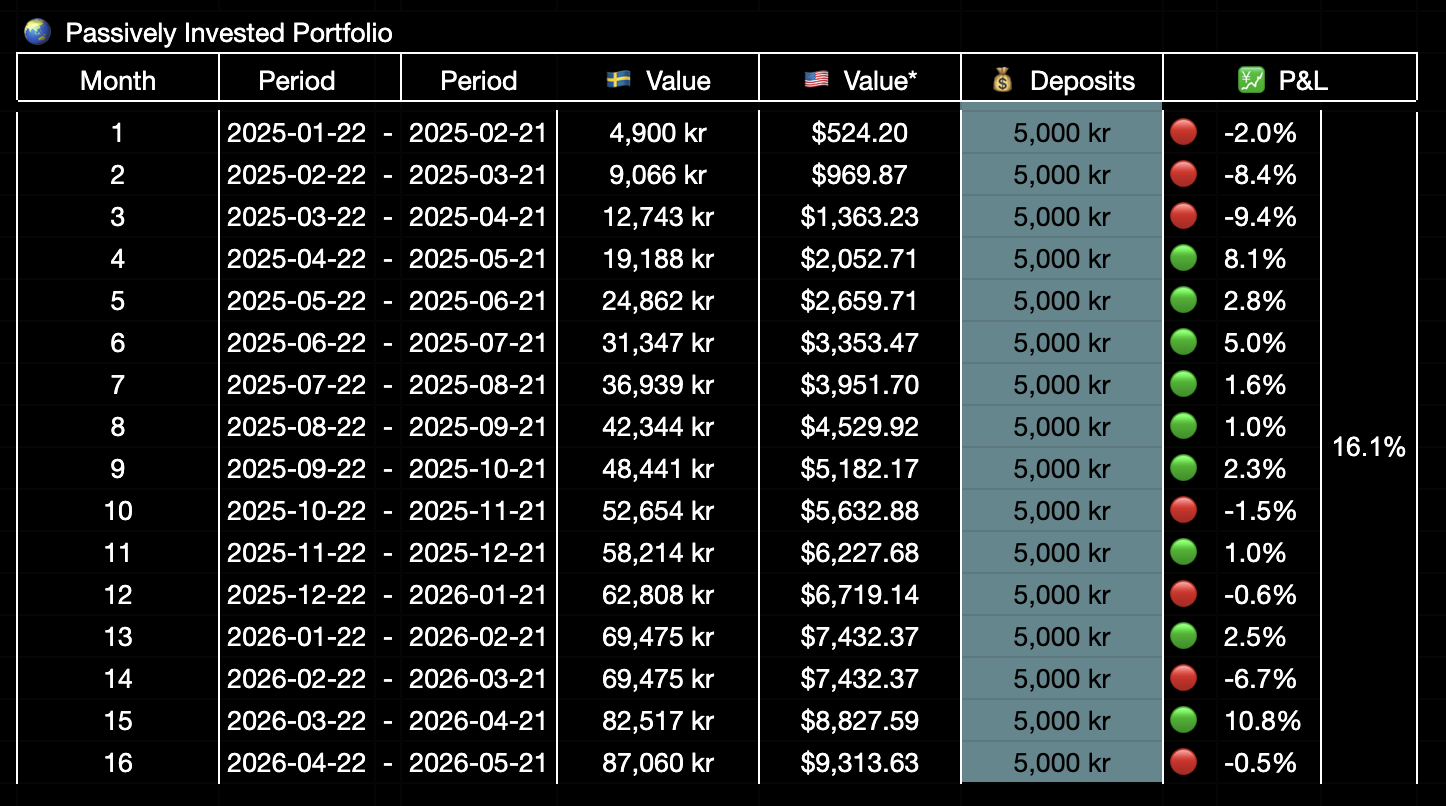 Performance: Month by Month, Passively Invested Portfolio
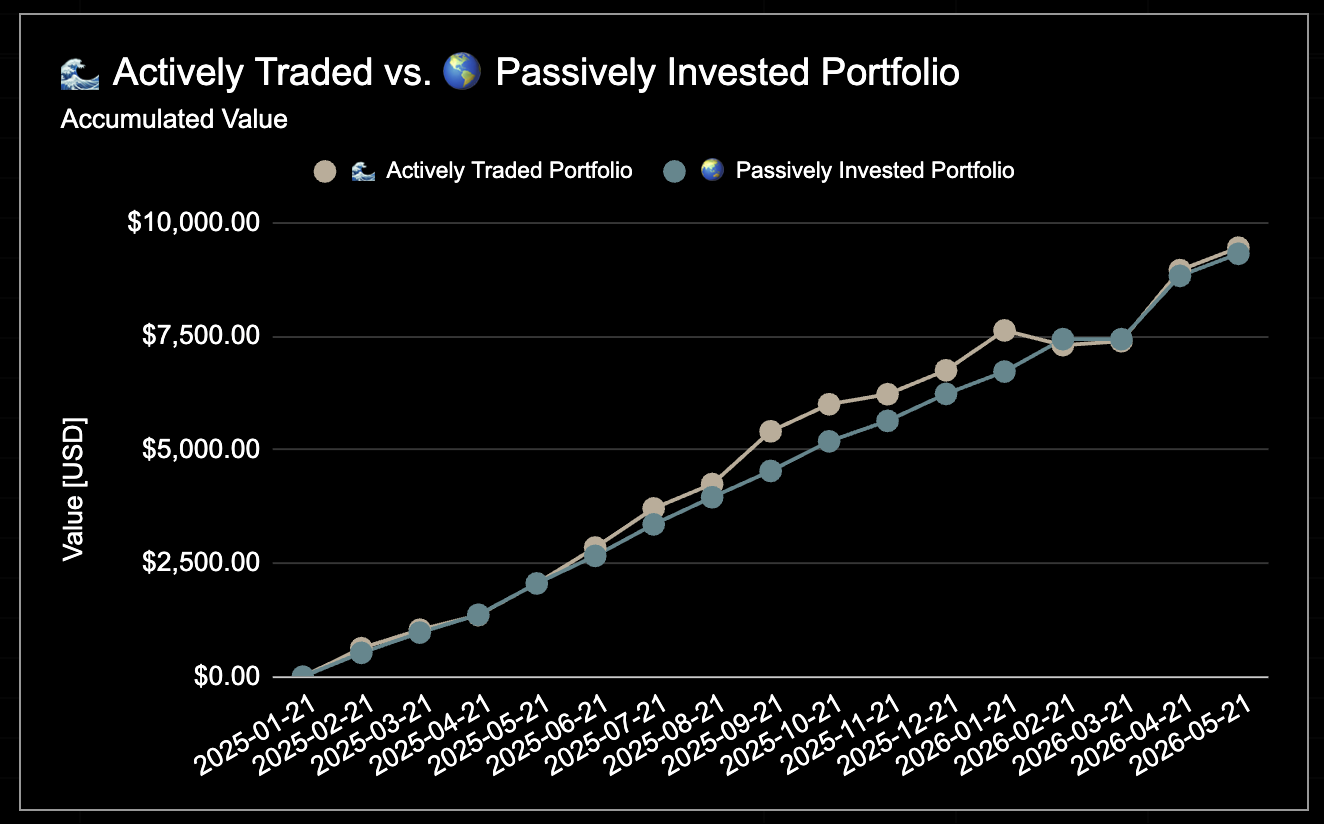 Performance: Month by Month, Chart
Open Positions
The portfolio consists of seven open trades: $PYPL, $NOVO-B (x2), $JD, $NVO, $BRKR, and $BABA. No changes from last month. $BRKR remains the largest single position at 19.0%, followed by the two $NOVO-B positions which together make up 22.4% of the portfolio.
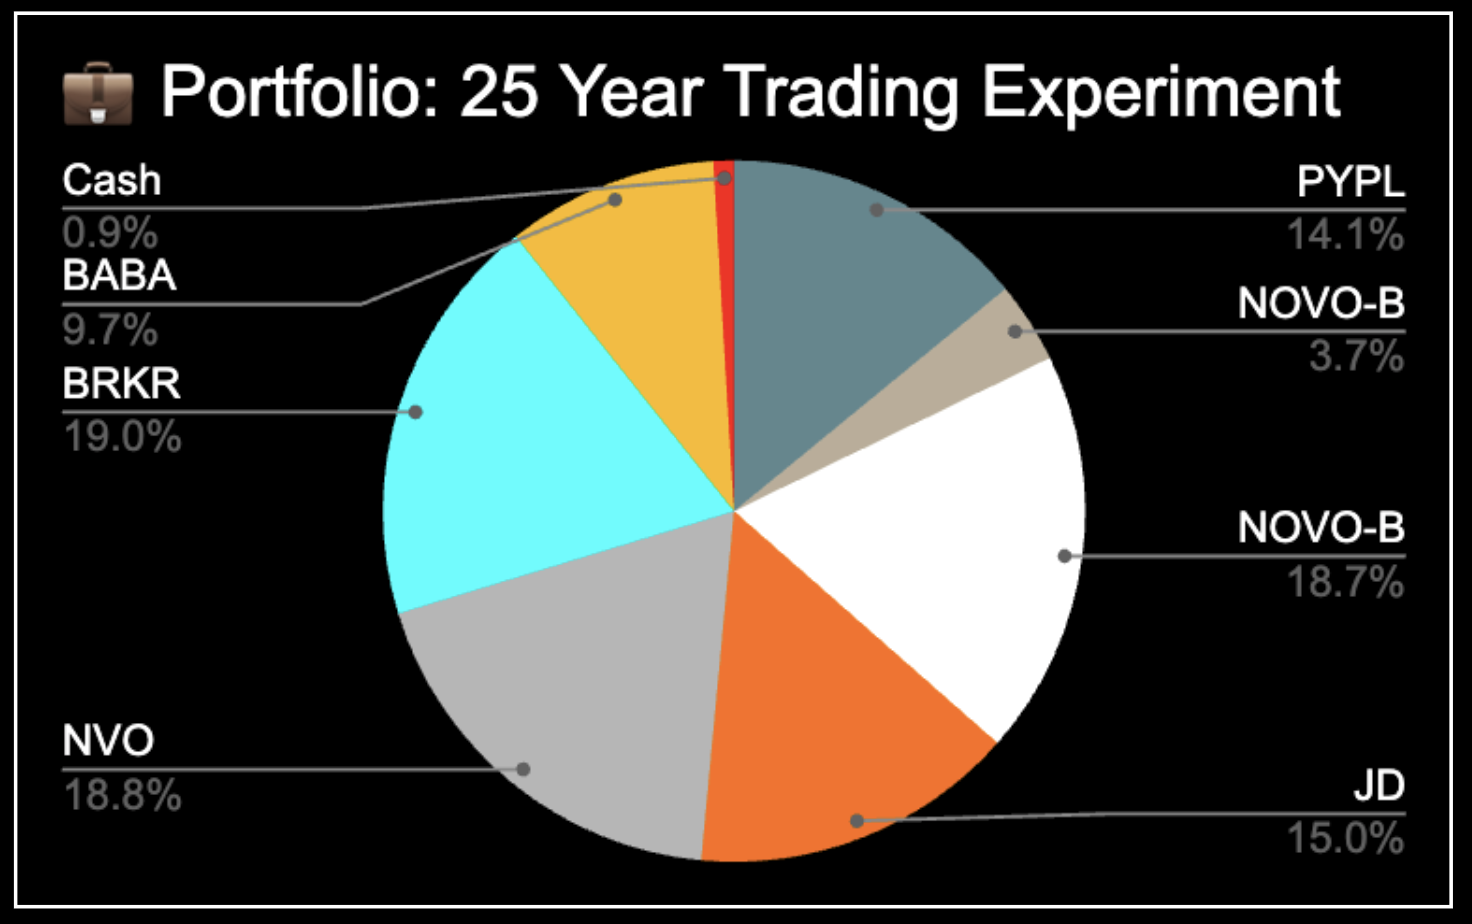 Open Positions
Risk is distributed across all seven positions, with $NOVO-B carrying the highest individual risk at around 7%.
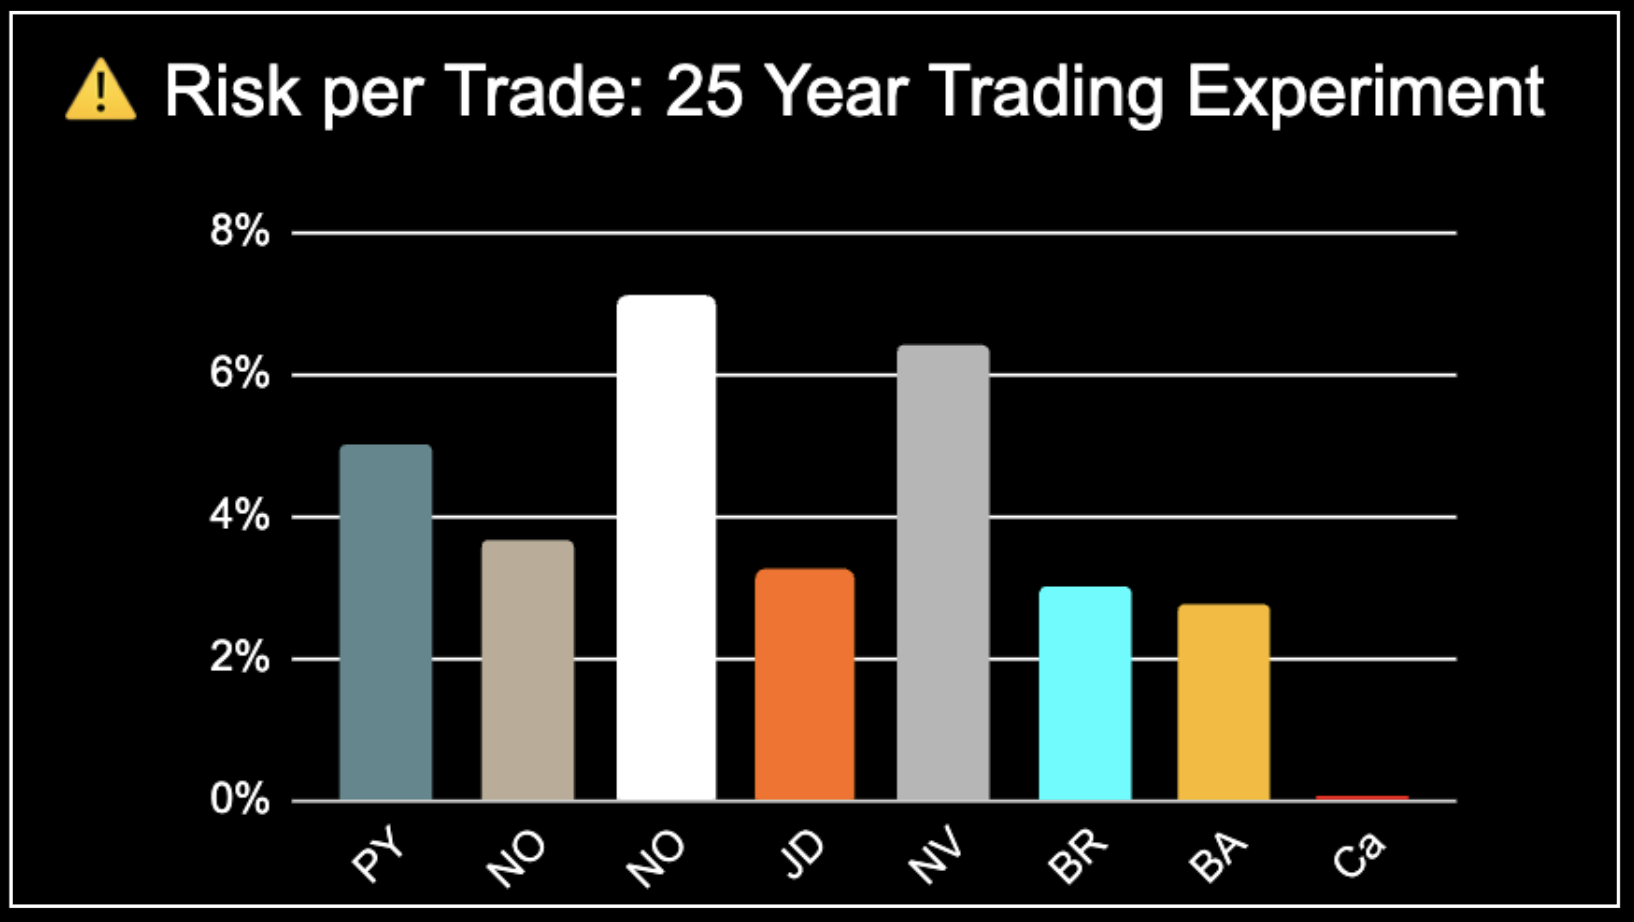 Risk per Trade
Open Positions: Detailed Overview
The following table contains the entry, stop loss, position size, and current market prices.
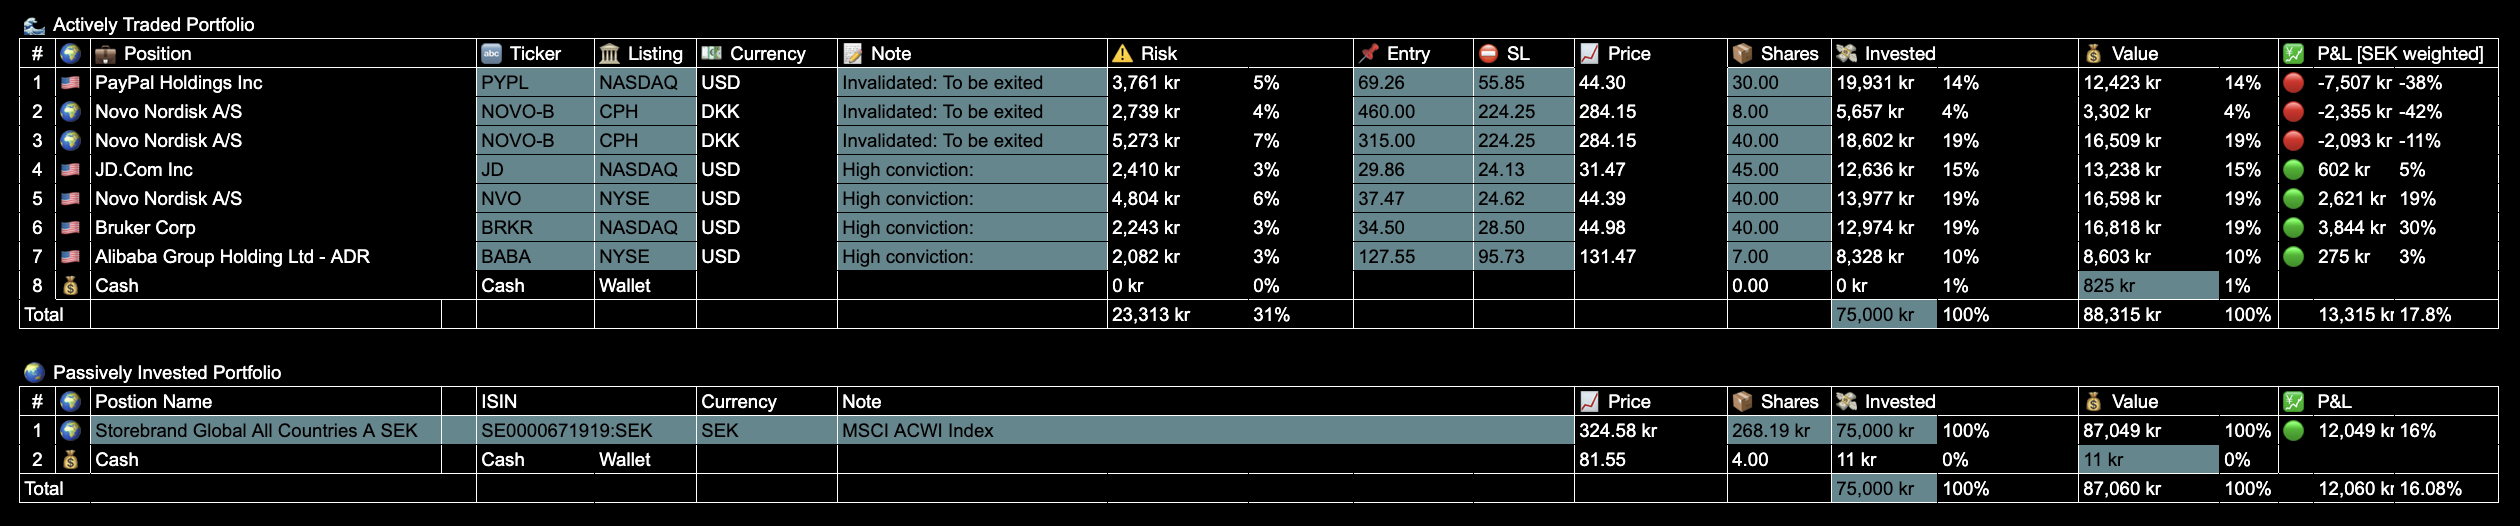 Open Trades: Details
Realized P&L & Win Rate
Since inception, I have realized 23 trades:
- 🟢 Winners
- 🔴 Losses
- 🟡 Break-even (+/- 3%)
- 🔵 Pending exit (invalidated or TP reached)
No new trades were closed this month. The win rate remains at 69% when excluding break-even trades, or 56% including them.
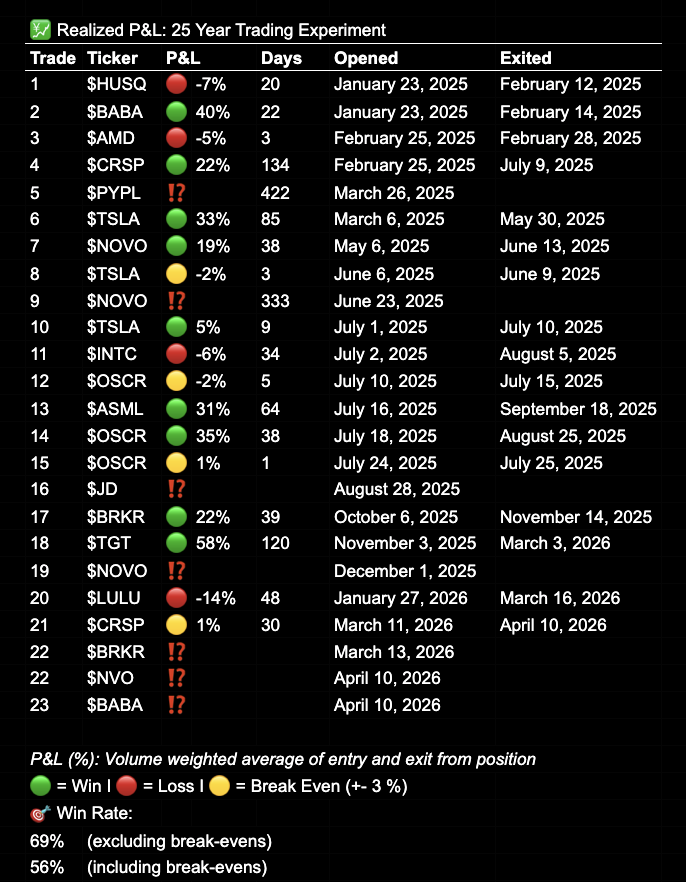 Realized P&L
25 Year Trading Experiment
For a full overview of the experiment’s purpose and structure, check out my 25 Year overview page, or watch the previously released YouTube introduction.
In short:
- 💰 10,000 SEK (~$1,000) invested monthly - split 50/50
- 🌊 Actively Traded vs 🌍 Passively Invested Global Index Fund
- 📅 Contributions on the 22nd of every month
- 🕰 Tracking my performance from 2025 to 2050
- 🌐 Transparency: Every trade shared publicly
Summary
Two months ago, the active portfolio was at -1.4% from inception. Last month, it bounced back to +11.6%. Now it sits at +17.8%. That is the power of staying in your trades and trusting the process.
The passive portfolio deserves credit too. It has been quietly compounding, and at +16.1% from inception it continues to prove why index investing is a strong baseline. Beating it over 25 years is the challenge I signed up for.
Right now, the active portfolio leads by 1.7 percentage points. Not a massive lead. Not a comfortable one. But a lead built on disciplined entries, managed risk, and the patience to let trades develop. That is the only kind of edge that compounds.
The portfolio is now 485 days old. Only about 8,650 more to go.
How are your portfolios performing this spring?
💬 Share your thoughts on X or Substack - I’m always interested in connecting with like-minded people.
High Conviction Swing Trading
Learn the full strategy
A structured swing trading course. Market structure, order blocks, position sizing, and trading psychology. Start Module 1 for free.
Start learning →