💼 Portfolio Update: 25 Year Trading Experiment | March 2026
Month 14. The past two months have left a massive gap between the actively traded portfolio and the passively invested one. The active side is not only negative year-to-date, but has now dipped into a small drawdown from inception - sitting at -1.4% while the passive portfolio is at +4.1%.
But these two months haven’t been all bad. The $TGT trade closed for a +58% gain after 120 days - one of the best single trades in the experiment so far. Two new positions have been opened in $CRSP and $BRKR, and the process continues with the long-term growth trajectory as the main goal.
All trades are always shared live on X.com/tradergu, and the public trading dashboard is updated with the latest trade details and up-to-date portfolio allocations.
Performance: Inception to Date
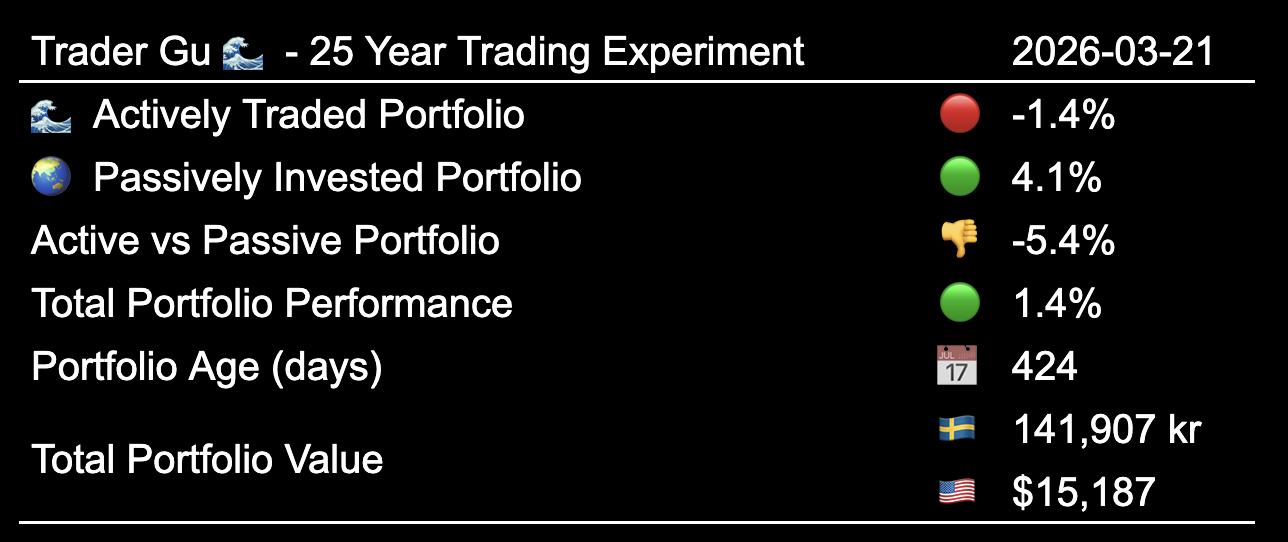
The total portfolio value is now worth $15,187. The actively traded portfolio has dipped into negative territory for the first time since the early months, while the passively invested portfolio remains positive.
- Actively Traded Portfolio: 🔴 -1.4%
- Passively Invested Portfolio: 🟢 +4.1%
 Performance: Inception to Date
The goal is to outperform the global index over a 25 year period through disciplined active Swing Trading.
Performance: Year to Date
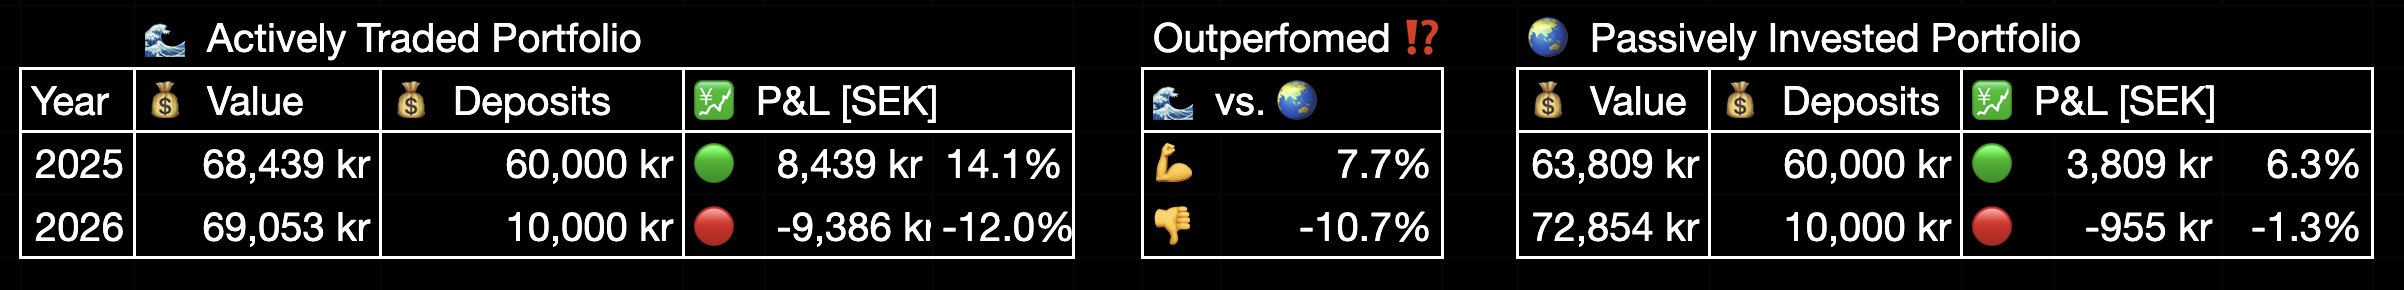
2026 continues to be a difficult year for the active portfolio. The actively traded portfolio is now down -12.0% year-to-date, while the passive side is down a more modest -1.3%. That’s a 10.7 percentage point gap in favor of passive year-to-date.
- Actively Traded Portfolio: 🔴 -12.0%
- Passively Invested Portfolio: 🔴 -1.3%
 Performance: Year to Date
Performance: Month to Month Overview
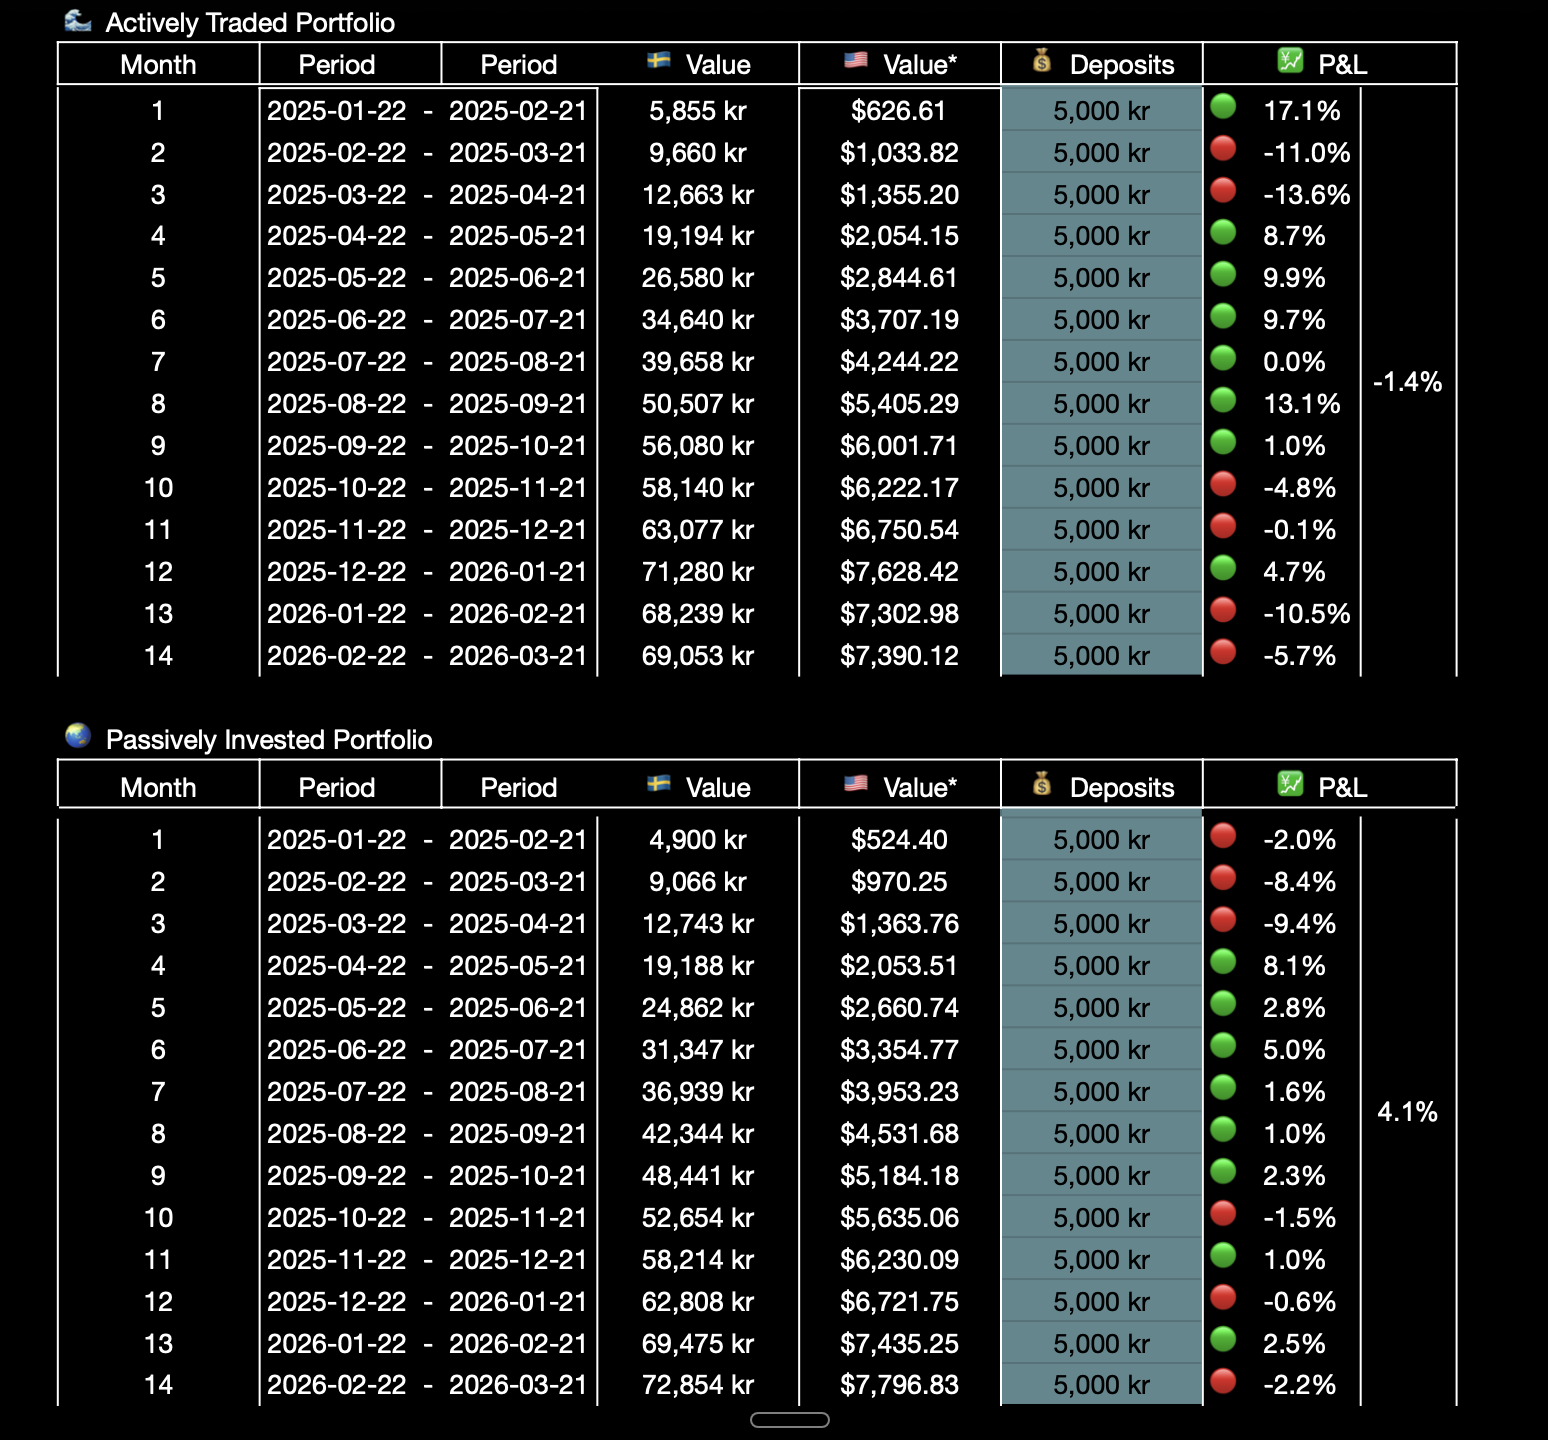
Month 14 saw the actively traded portfolio drop another -5.7%, while the passive side declined -2.2%. Both portfolios were down this month, reflecting broader market weakness.
 Performance: Month by Month, Table
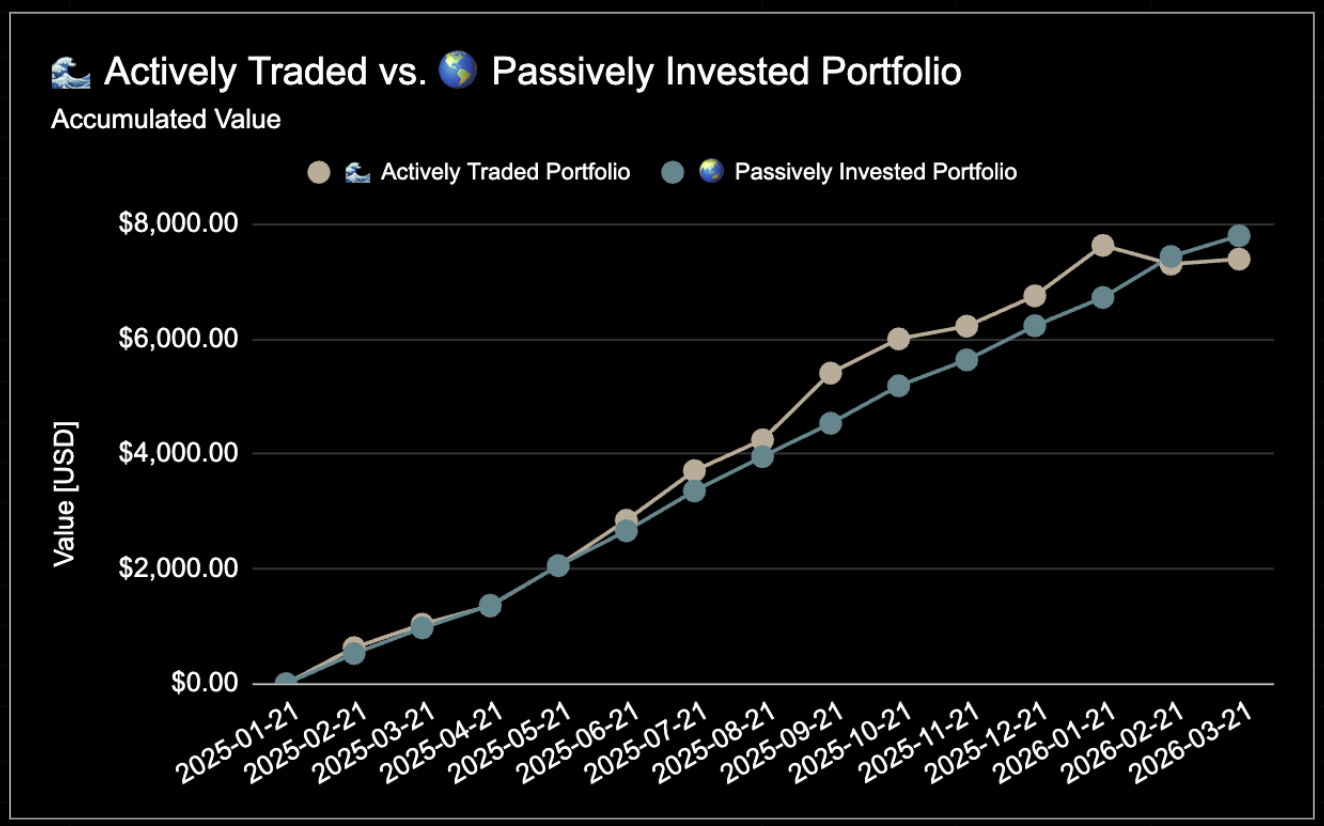 Performance: Month by Month, Chart
Open Positions
The portfolio currently consists of six open trades: $PYPL, $NOVO-B (x2), $JD, $CRSP, and $BRKR, with 8.0% in cash.
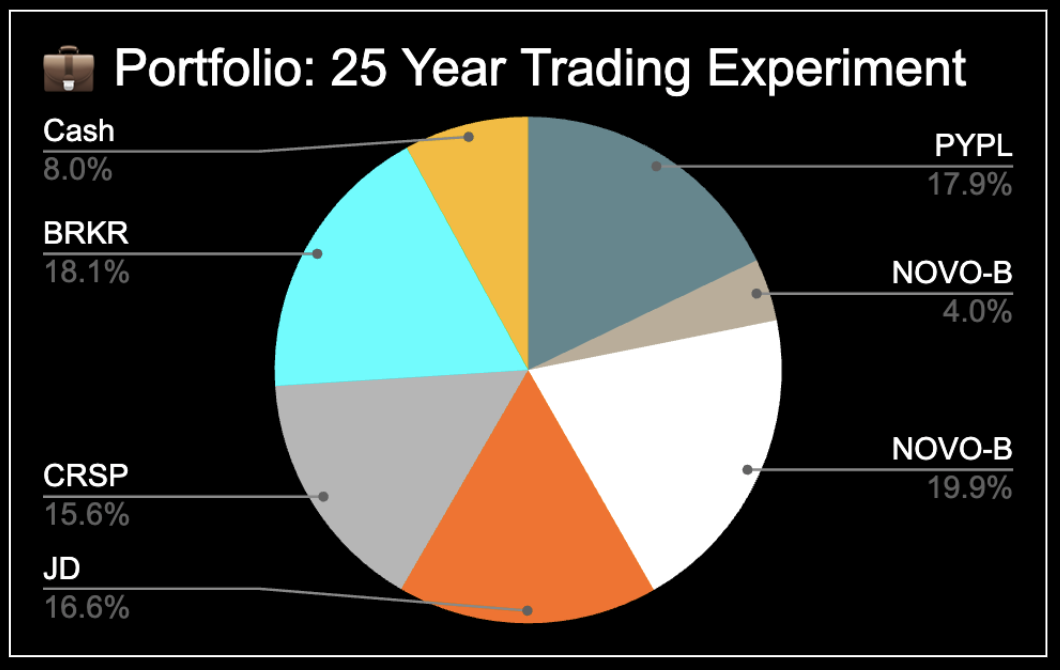 Open Positions
The total invested capital at risk remains elevated. $CRSP carries the highest individual risk, while $PYPL continues to be a drag on the portfolio from the gap below my stop loss last month.
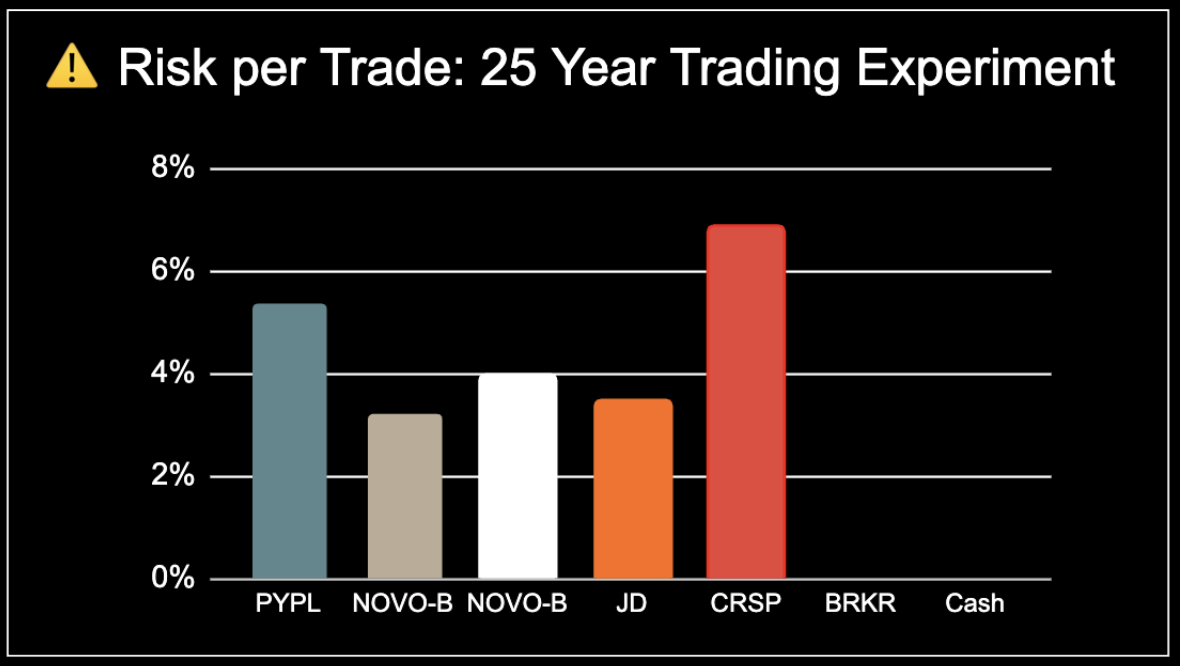 Risk per Trade
Open Positions: Detailed Overview
The following table contains the entry, stop loss, position size, and current market prices.
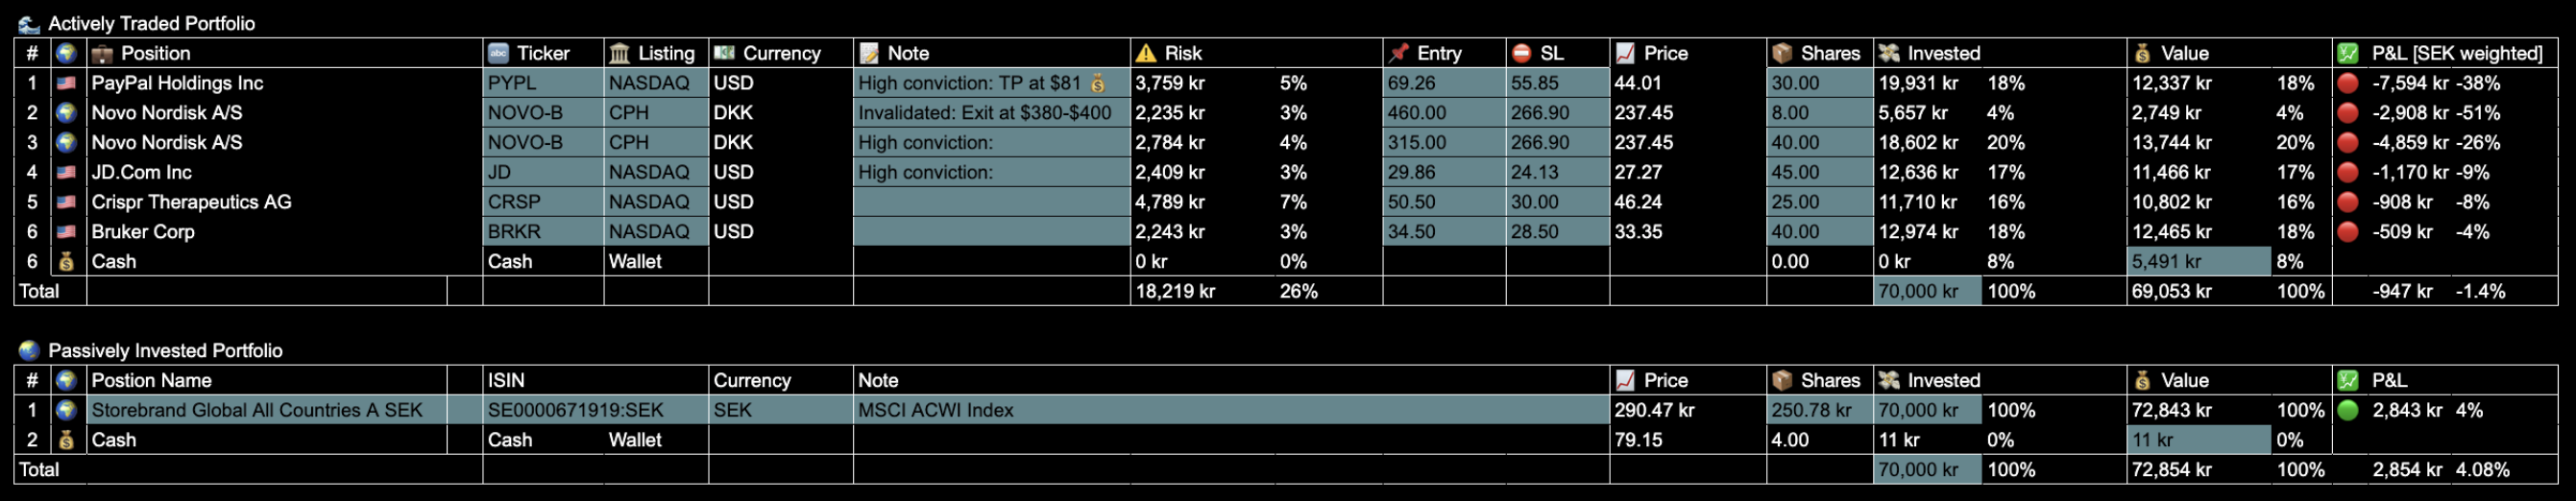 Open Trades: Details
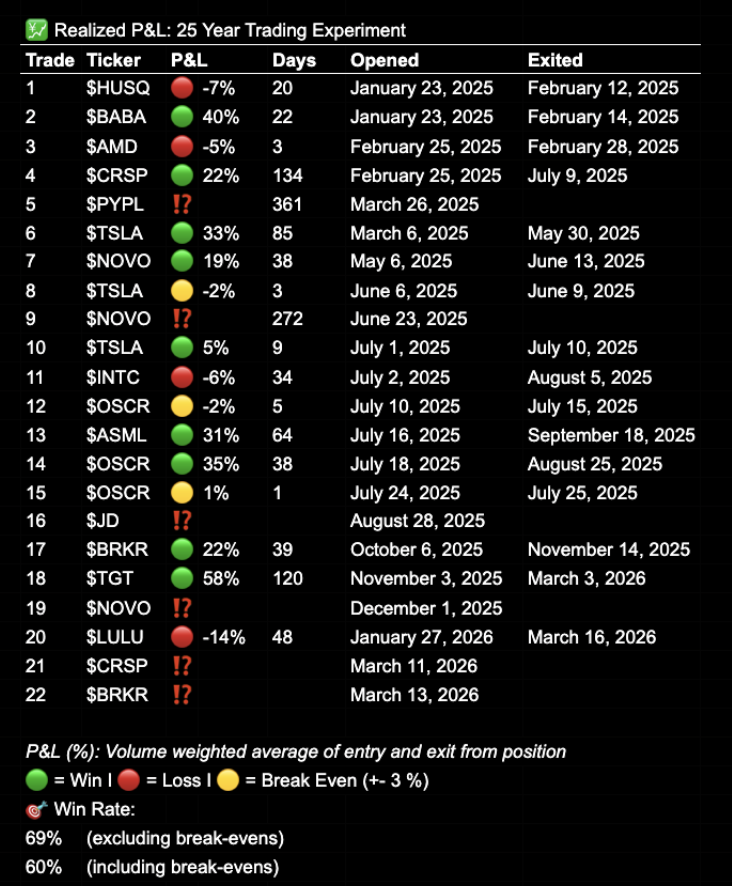
Realized P&L & Win Rate
Since inception, I have realized 22 trades:
- 🟢 9 Winners
- 🔴 4 Losses
- 🟡 3 Break-even (+/- 3%)
- 🔵 6 Pending exit (invalidated or TP reached)
This translates to a 69% win rate when excluding break-even trades, or 60% including them. The highlight this month was $TGT, closed at +58% after 120 days - the best single trade in the experiment. On the other side, $LULU was stopped out at -14%.
 Realized P&L
25 Year Trading Experiment
For a full overview of the experiment’s purpose and structure, check out my 25 Year overview page, or watch the previously released YouTube introduction.
In short:
- 💰 10,000 SEK (~$1,000) invested monthly - split 50/50
- 🌊 Actively Traded vs 🌍 Passively Invested Global Index Fund
- 📅 Contributions on the 22nd of every month
- 🕰 Tracking my performance from 2025 to 2050
- 🌐 Transparency: Every trade shared publicly
Summary
Two months of underperformance and the actively traded portfolio is behind the passively invested one by roughly 5.4 percentage points. The numbers don’t lie - it’s been a rough two months.
But zooming out, this is month 14 of a 300-month experiment, and I’ve never felt more confident in my trading. That said, I failed to execute some trades the way I should have over the past two months - and there are no excuses for that. One of the most difficult things about trading is exiting losers when you know you should, but you don’t want to realize the loss. That’s something I need to work on going forward.
I’ve already improved slightly - I exited a newly opened position in $LULU when it was invalidated according to my strategy, instead of holding and hoping. Now there are two new trades in the portfolio, $CRSP and $BRKR - both names I had strong trades in over the past year, and now they’ve set up again.
The process stays the same:
- Focus on finding high-conviction setups
- Manage risk accordingly
- Let the trades play out
- Avoid being greedy on the exits
How are your portfolios holding up in this market?
💬 Share your thoughts on X or Substack - I’m always interested in connecting with like-minded people.