💼 Portfolio Update: 25 Year Trading Experiment | July 2025
It’s the middle of the summer, and it’s been 180 days since I started the 25 Year Trading Experiment. Much has happened in the past few months: the portfolio has increased, lessons learn and I’m thrilled sharing the July update.
All trades are always shared live on X.com/tradergu, and the public trading dashboard is always updated with the latest trade details and up-to-date portfolio allocations.
Performance: Year to Date
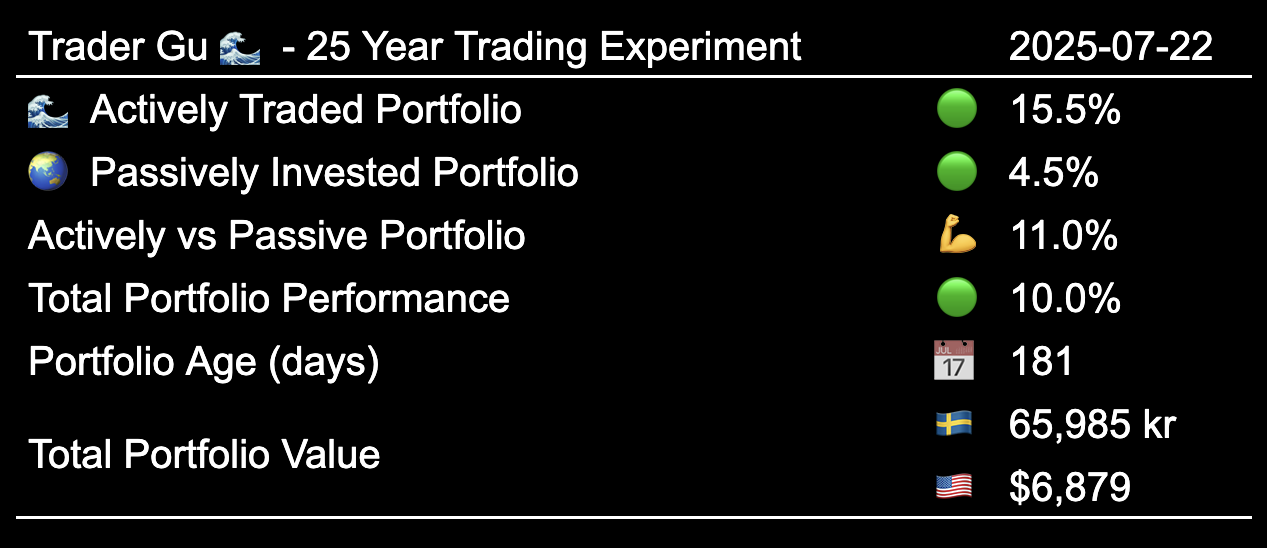
Both portfolios are in profit, and the actively traded portfolio has outperformed the passively invested portfolio by 💪 11 percentage points year to date.
- Actively Traded Portfolio: 🟢 +15.5%
- Passively Invested Portfolio: 🟢 4.5%
 Performance: Year to Date
Performance: Month to Month Overview
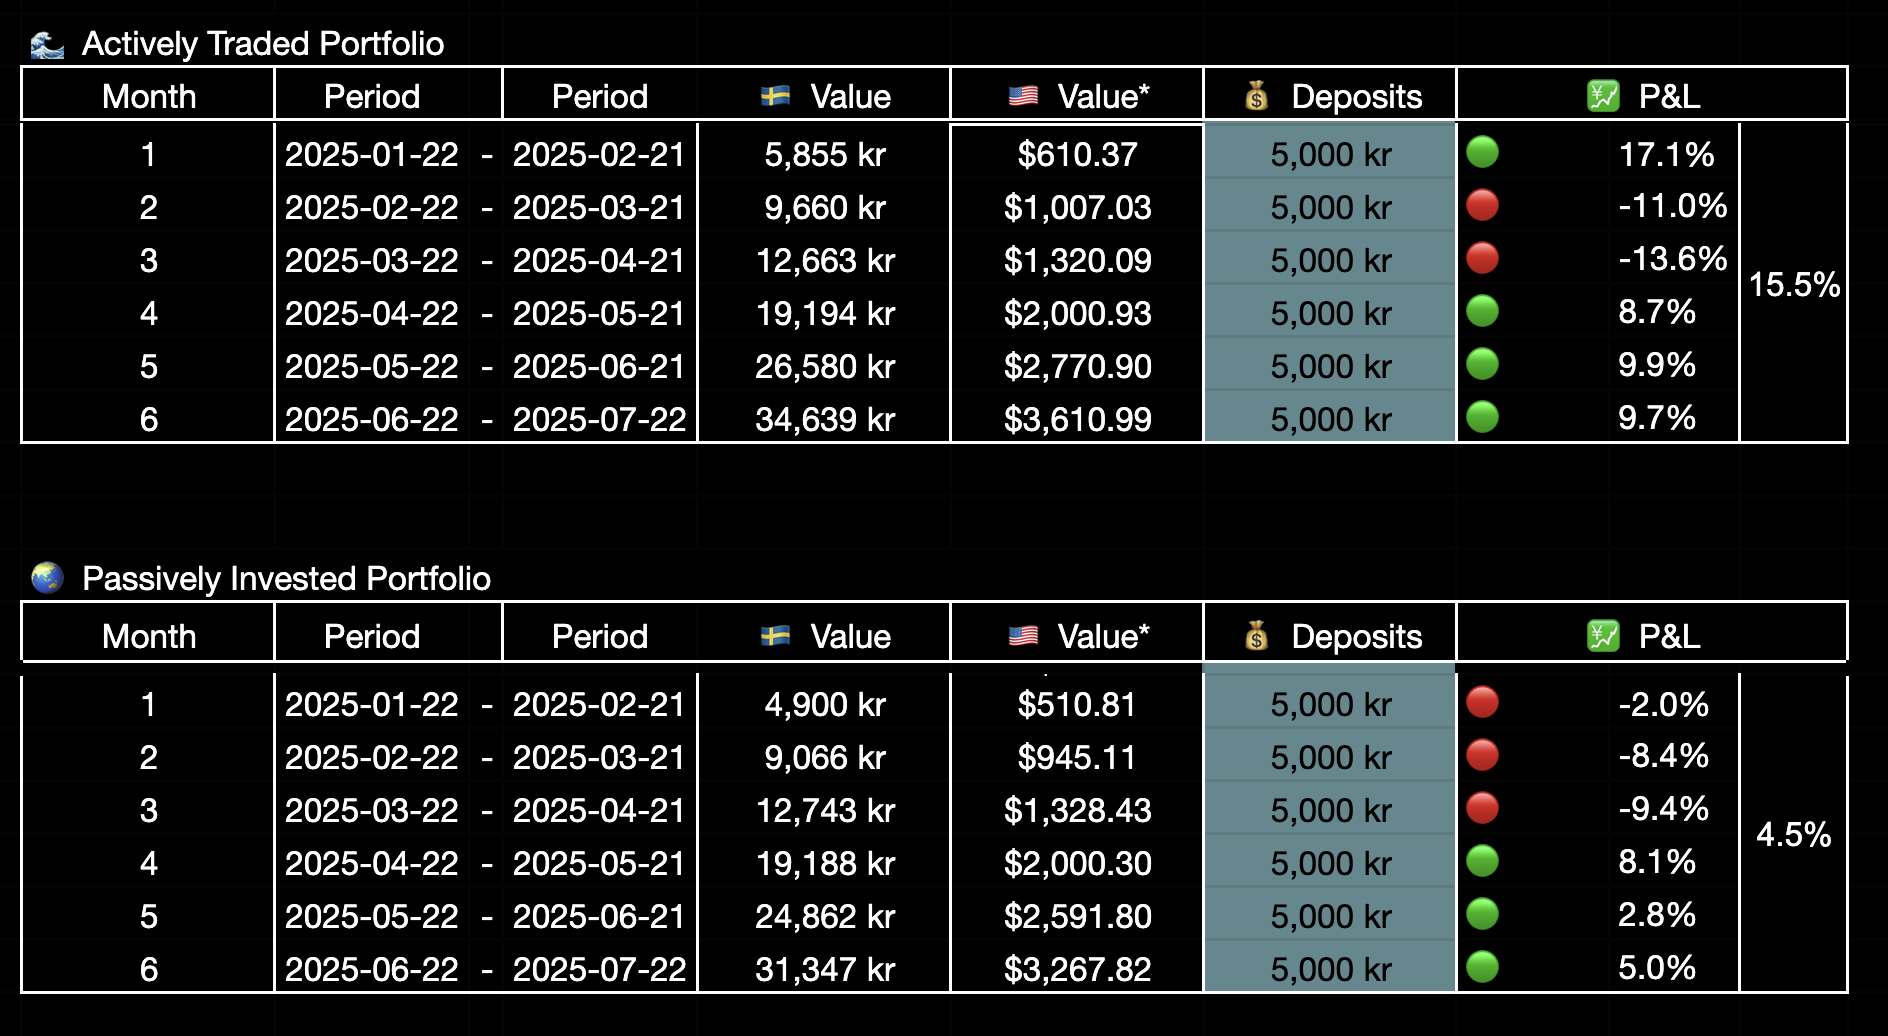
On a month-to-month perspective, the actively traded portfolio has outperformed the passively invested portfolio 4 out of 6 months.
Although the first month was the best performer, the portfolio size was so small it barely made a dent in overall performance. The past three months have delivered a steady ~9% monthly portfolio increase.
 Performance: Month by Month, Table
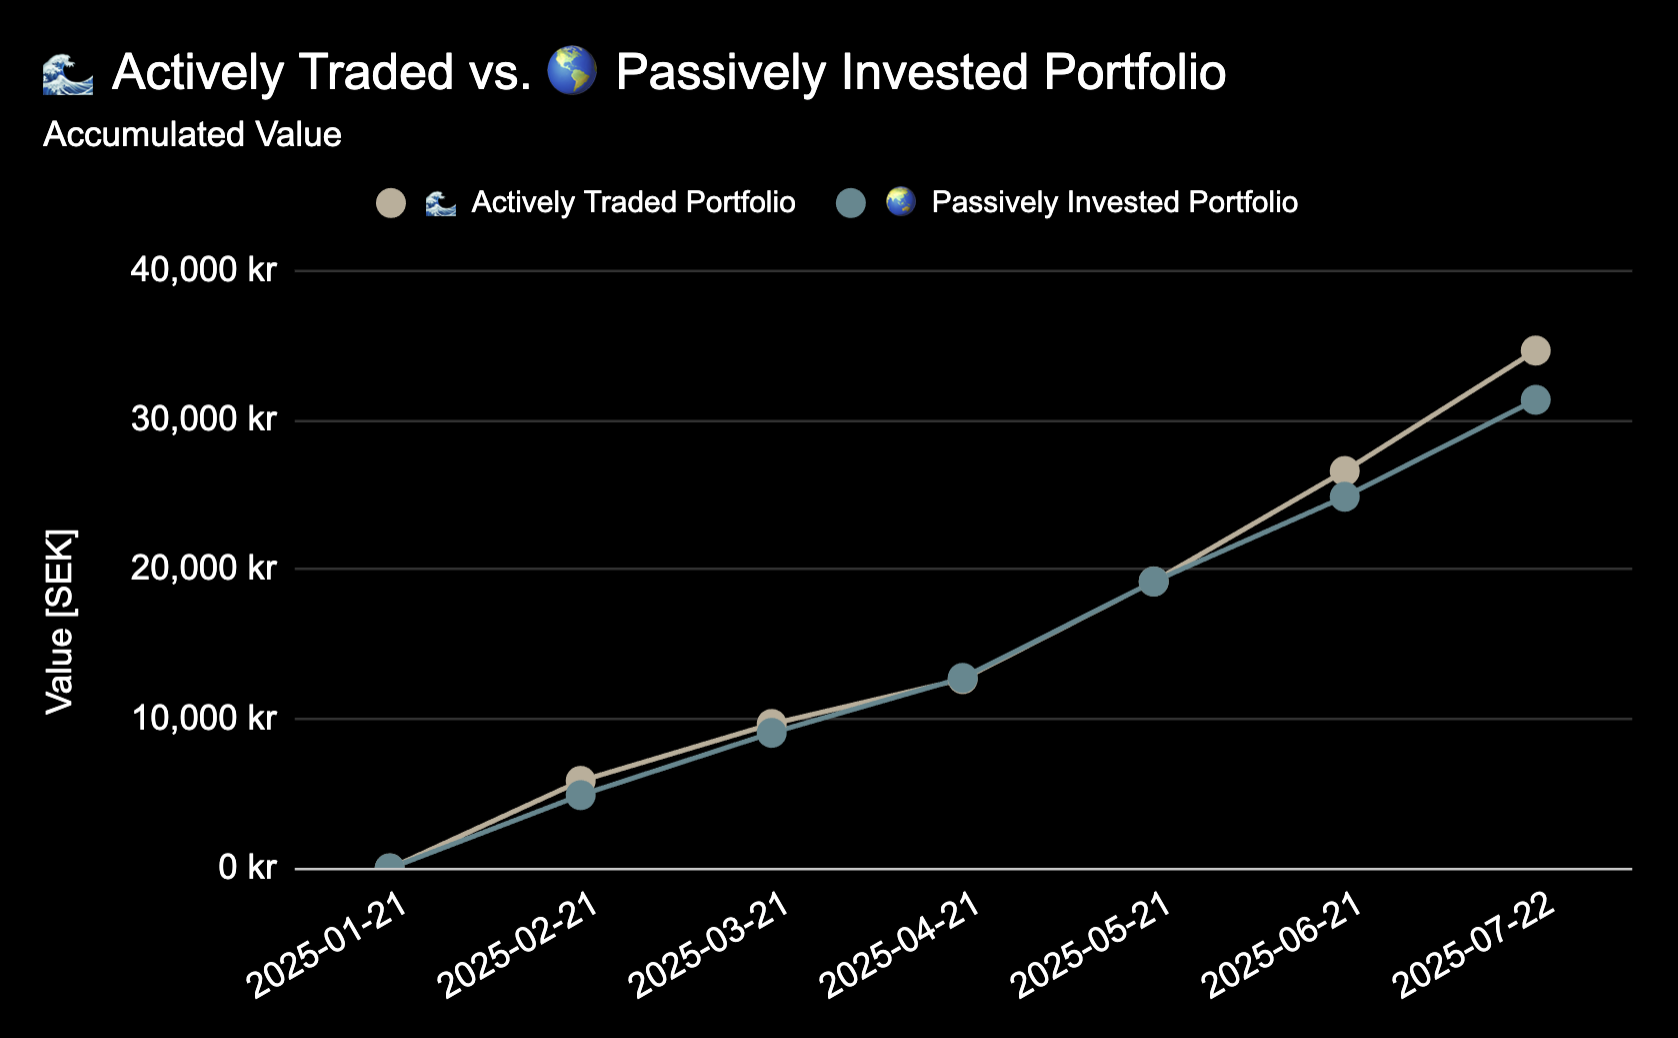 Performance: Month by Month, Chart
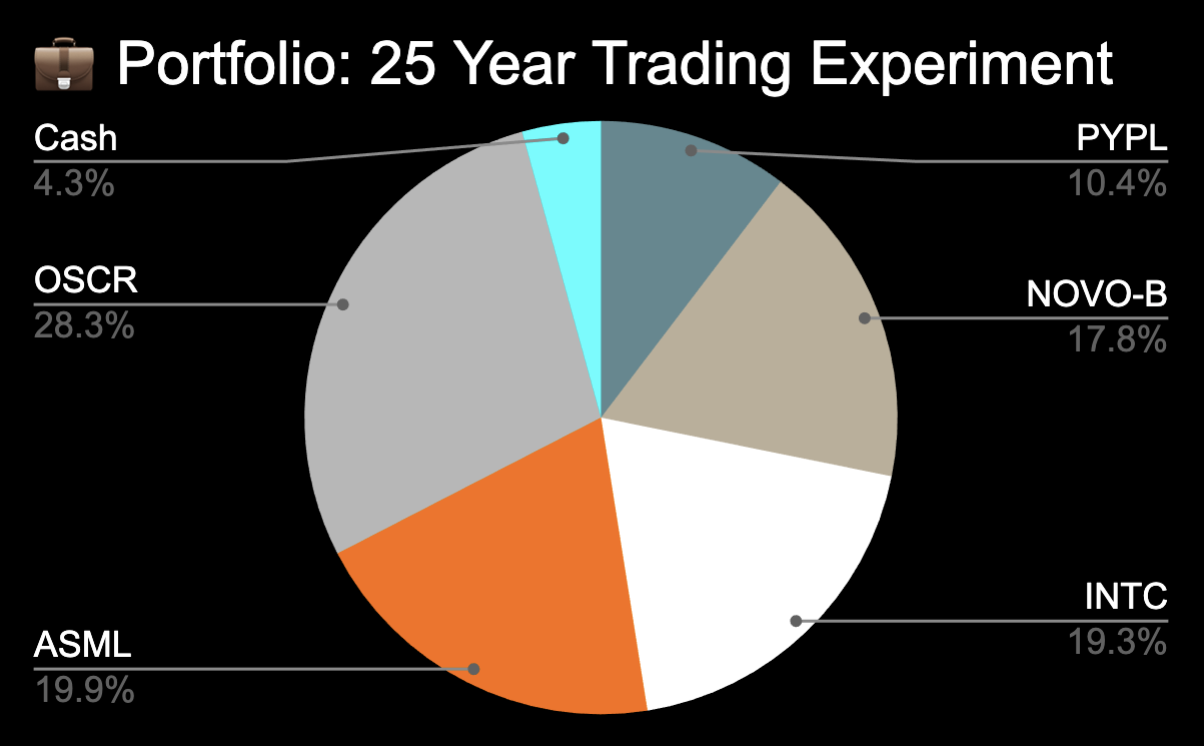
Open Positions
The portfolio currently consists of 5 open positions: $PYPL, $NOVO, $INTC, $ASML, $OSCR.
 Open Positions
The total risk of invested capital is currently ⚠️ 20% with a range of risk per trade from 2% to 5%.
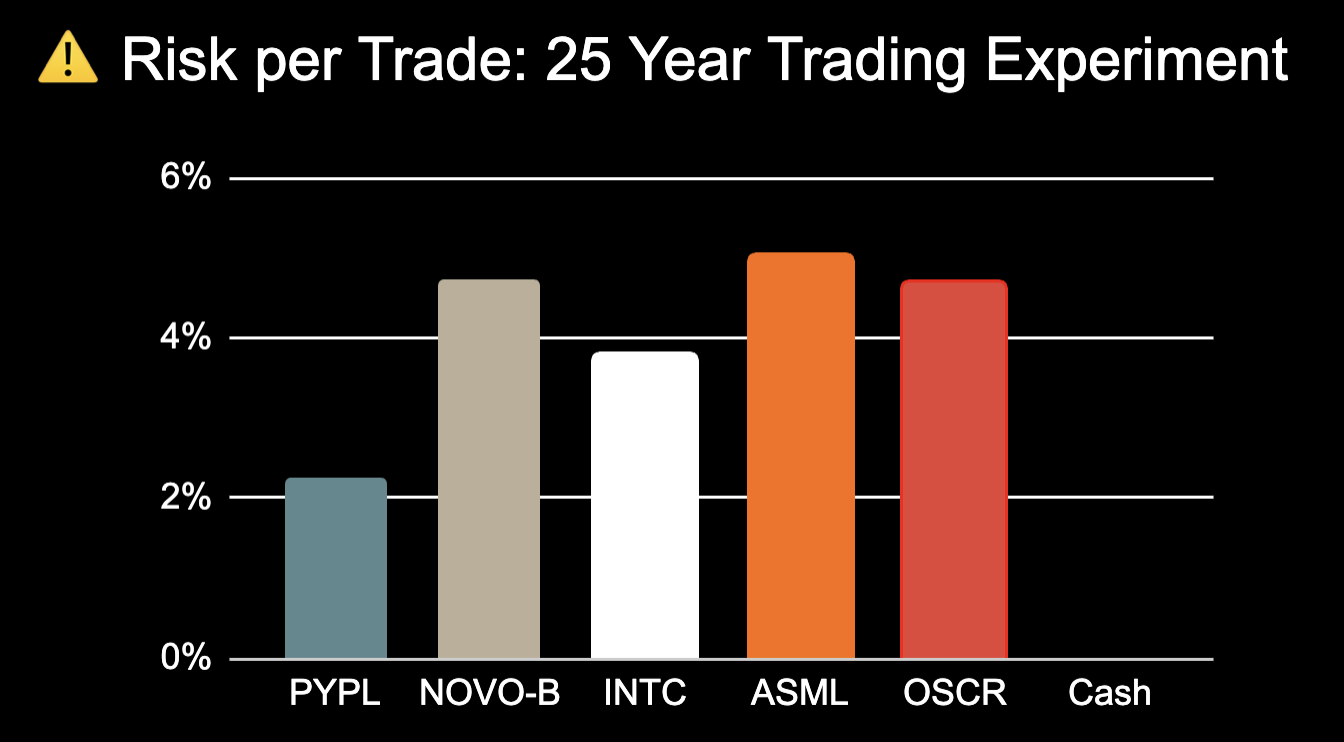 Risk per Trade
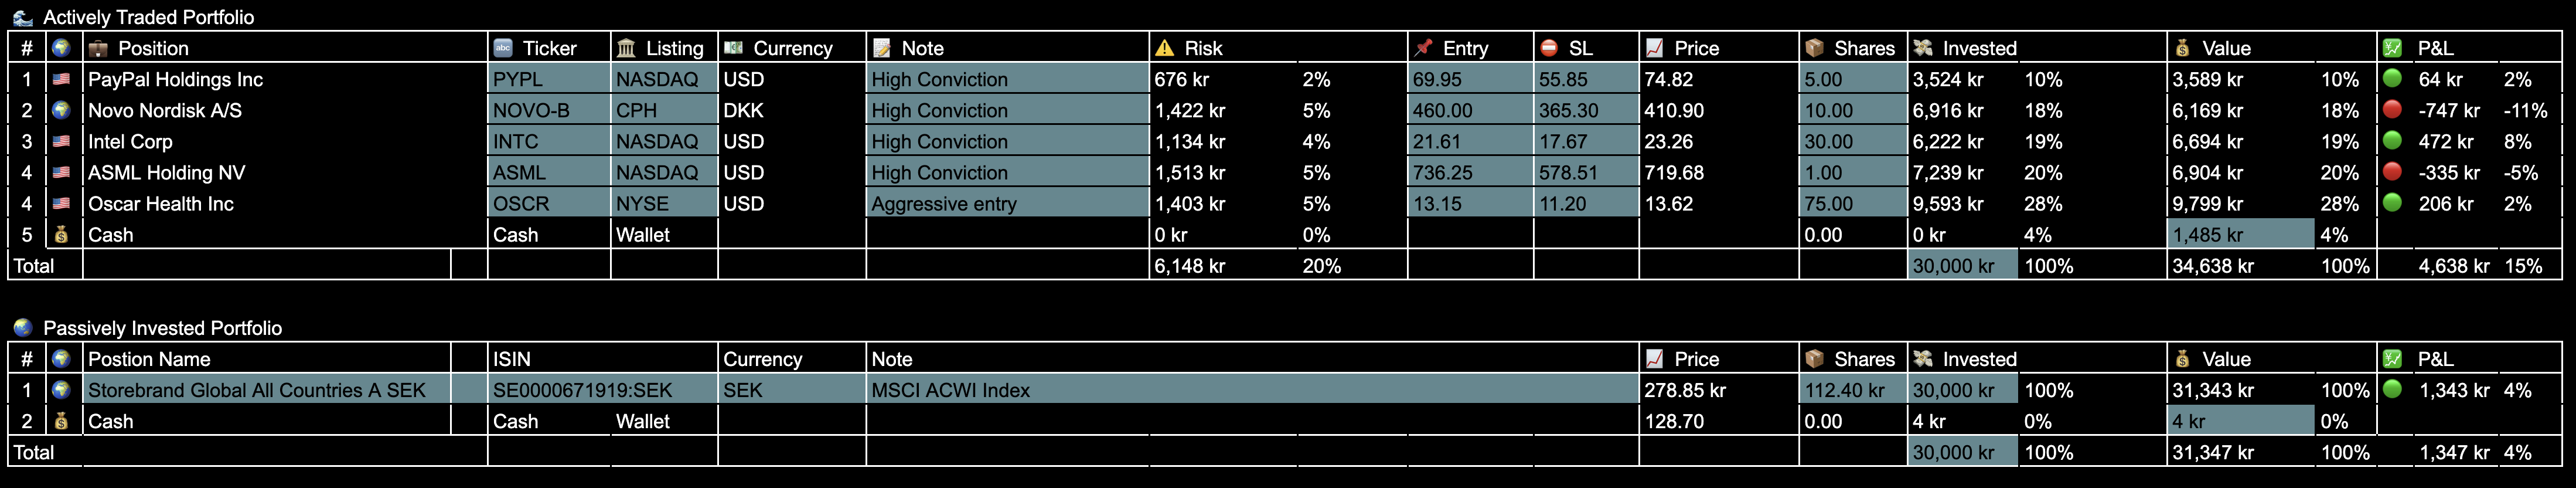
Open Positions: Detailed Overview
The following table contains the entry, stop loss, position size, and current market prices.
 Open Trade: Details
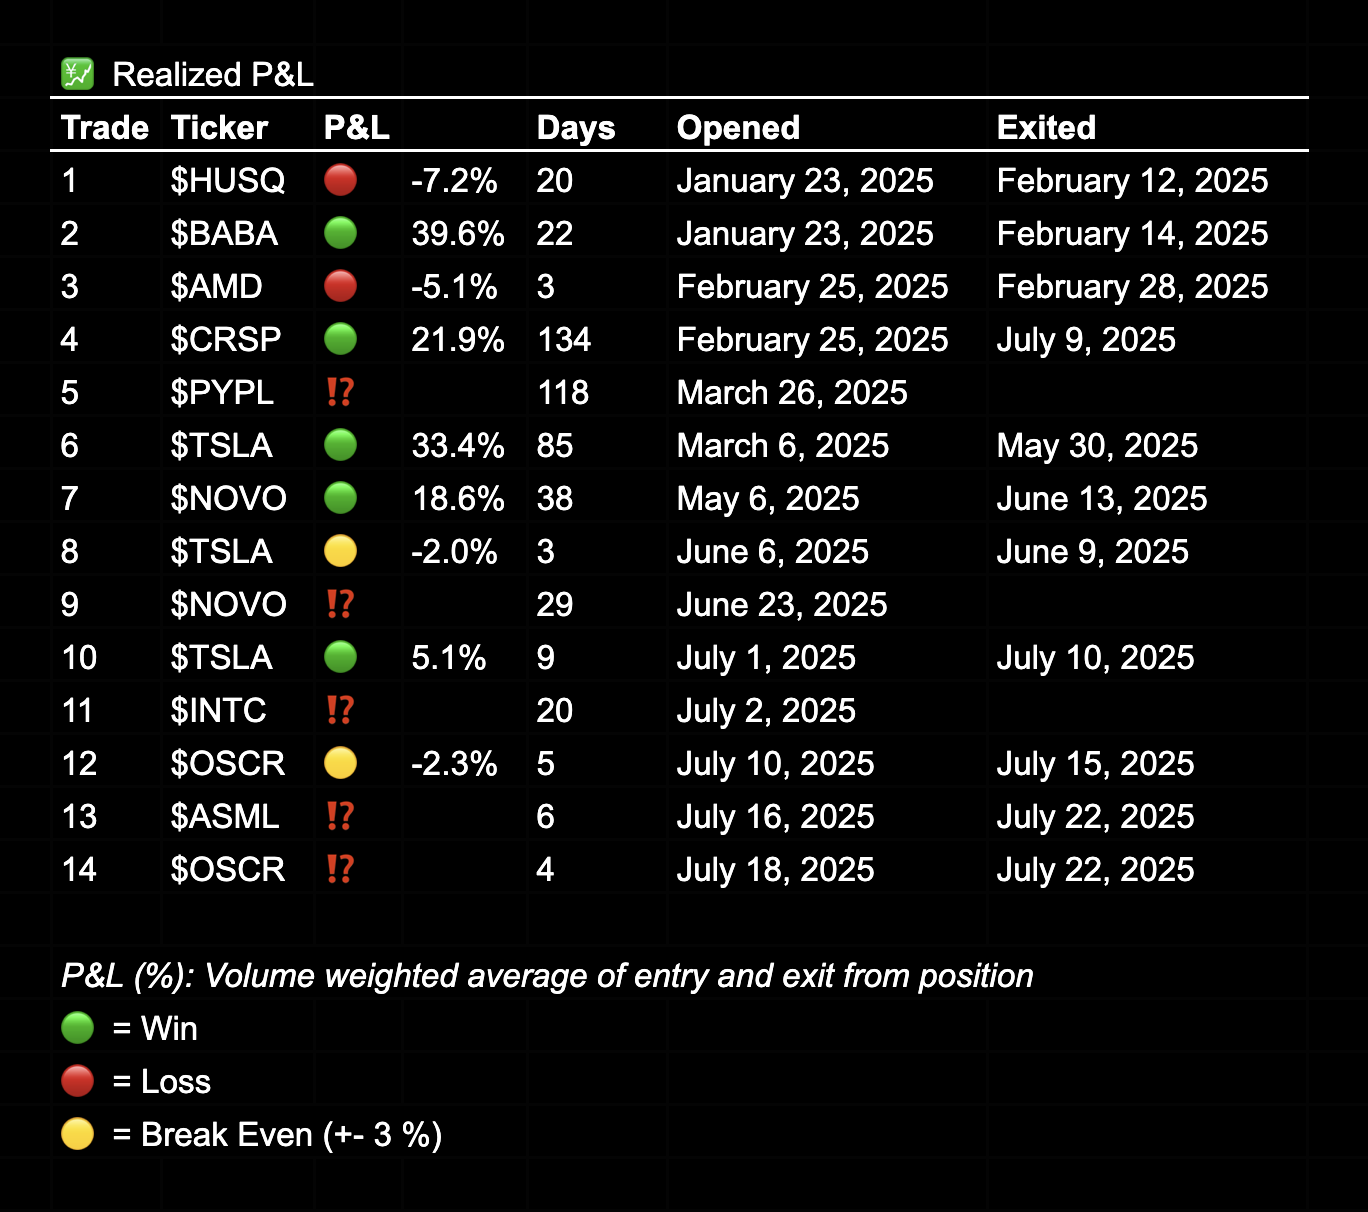
Realized P&L
Since inception, I have realized 10 trades:
- 🟢 5 Winners
- 🔴 2 Losses
- 🟡 2 Break-even (+- 3%)
The best trades percentage-wise have been $BABA, $CRSP, and $TSLA, each delivering between 19% and 40% from entry to exit. Losses have been modest, with a maximum loss of just 7.2%. Trade durations have ranged from 3 to 134 days.
Realized P&L
25 Year Trading Experiment
For a full overview of the experiment’s purpose and structure, check out my First Post from January 2025, or watch the newly released YouTube introduction.
In short:
- 💰 10,000 SEK (~$1000) invested monthly — split 50/50
- 🌊 Actively Traded vs 🌍 Passively Invested Global Index Fund
- 📅 Contributions on the 22nd of every month.
- 🕰 Tracking my performance from 2025 to 2050.
- 🌐 Transparency: Every trade shared publicly.
Summary
Six months have flown by, and although it’s been a highly volatile first two quarters, I’m thrilled to see the passively invested portfolio is out of its long-term drawdown and currently sitting at 🟢 +4.5%. Meanwhile, my Global Index benchmark remains in drawdown — highlighting how dollar-cost averaging (DCA) can be a powerful strategy to benefit from volatility in both directions. If I had lump-sum invested all deposits into the passive portfolio at the beginning, it would still be in drawdown.
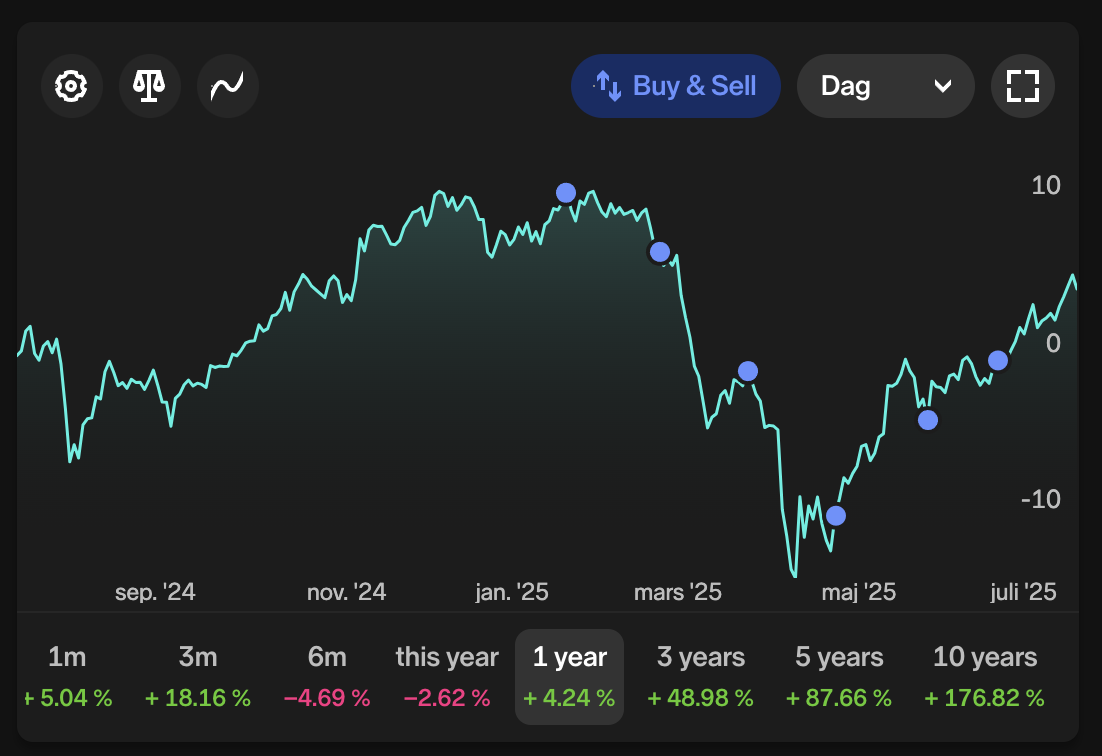
Passively invested portfolio benefiting from dollar-cost averaging (DCA)
As for my trading performance, I’m still a bit disappointed in a few decisions (which I’ll walk through in an upcoming trade review), but overall, I’m satisfied. I’ve stuck to the strategy, executed consistently, and the actively traded portfolio is now showing meaningful profits.
How are you tracking your trading performance?
💬 Share your thoughts on X or Substack — I’m always interested in connecting with like-minded people.