💼 Portfolio Update: 25 Year Trading Experiment | January 2026
We’ve finally made it. After 365 days, I’ve officially completed year one of my 25 Year Trading Experiment. The time went by faster than I expected, and I’m grateful for the consistency and discipline it took to see this first phase through. Now it’s time to break down the numbers - how things are shaping up so far, and what the trajectory could look like over the coming years if I continue to outperform the market.
All trades are always shared live on X.com/tradergu, and the public trading dashboard is updated with the latest trade details and up-to-date portfolio allocations.
Performance: Inception to Date
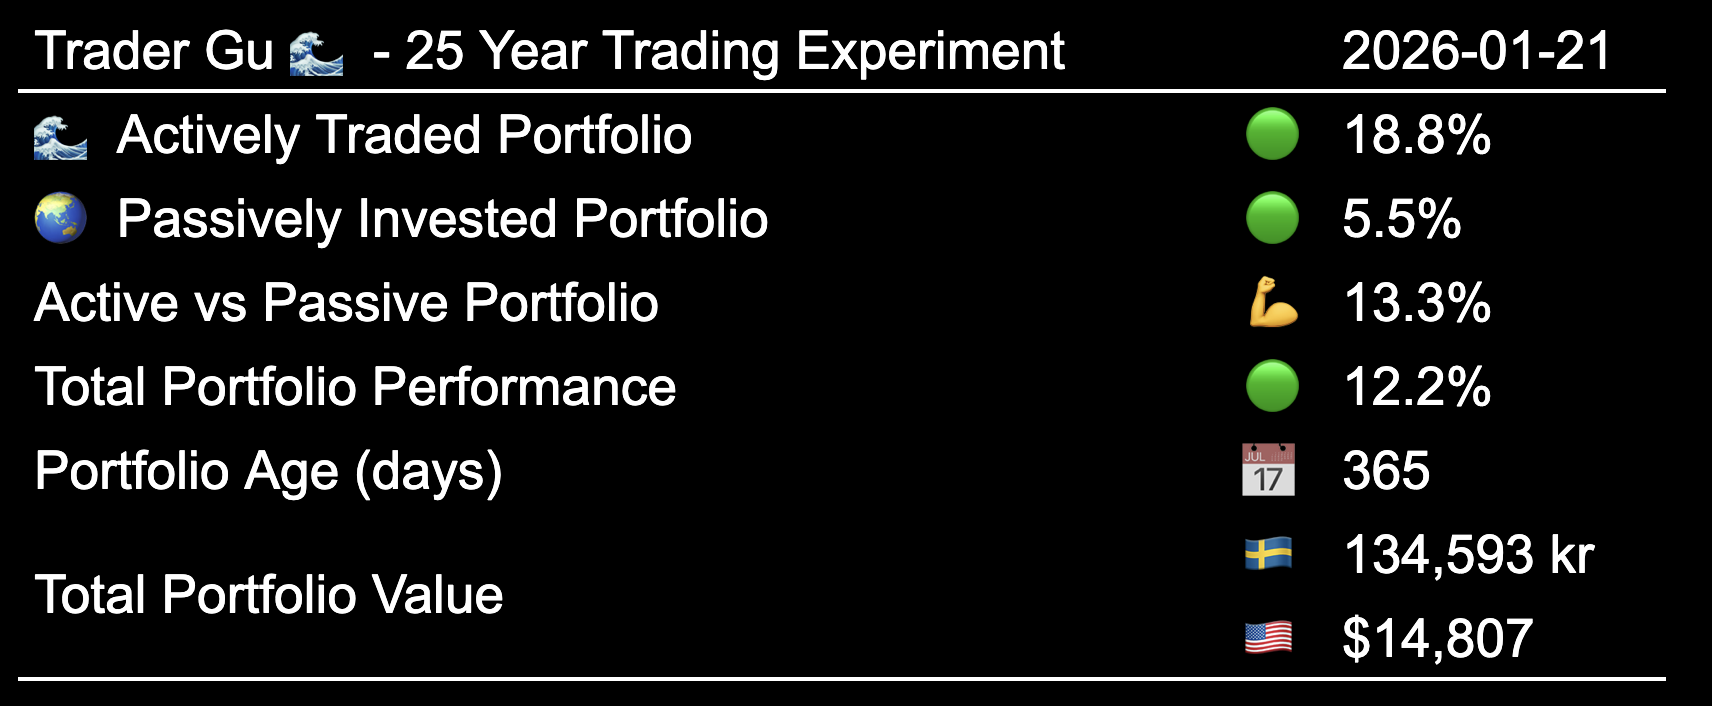
The total portfolio value is now worth $14,800. Both portfolios are in profit, and the Actively Traded Portfolio has outperformed the Passively Invested Portfolio by 13.3 percentage points, from inception-to-date 💪.
- Actively Traded Portfolio: 🟢 +18.8%
- Passively Invested Portfolio: 🟢 +5.3%
 Performance: Inception to Date
The goal is to outperform the global index over a 25 year period through disciplined active Swing Trading.
Performance: Year to Date
2026 has just began, and volaility has favord open positions and the actively traded portfolio is currently outperforming by 4.9 percentage points year-to-date.
- Actively Traded Portfolio: 🟢 +4.2%
- Passively Invested Portfolio: 🔴 +0.9%
 Performance: Year to Date
Performance: Month to Month Overview
On a month-to-month basis, both portfolio’s have only experienced 4 negative months, 33% of the year.
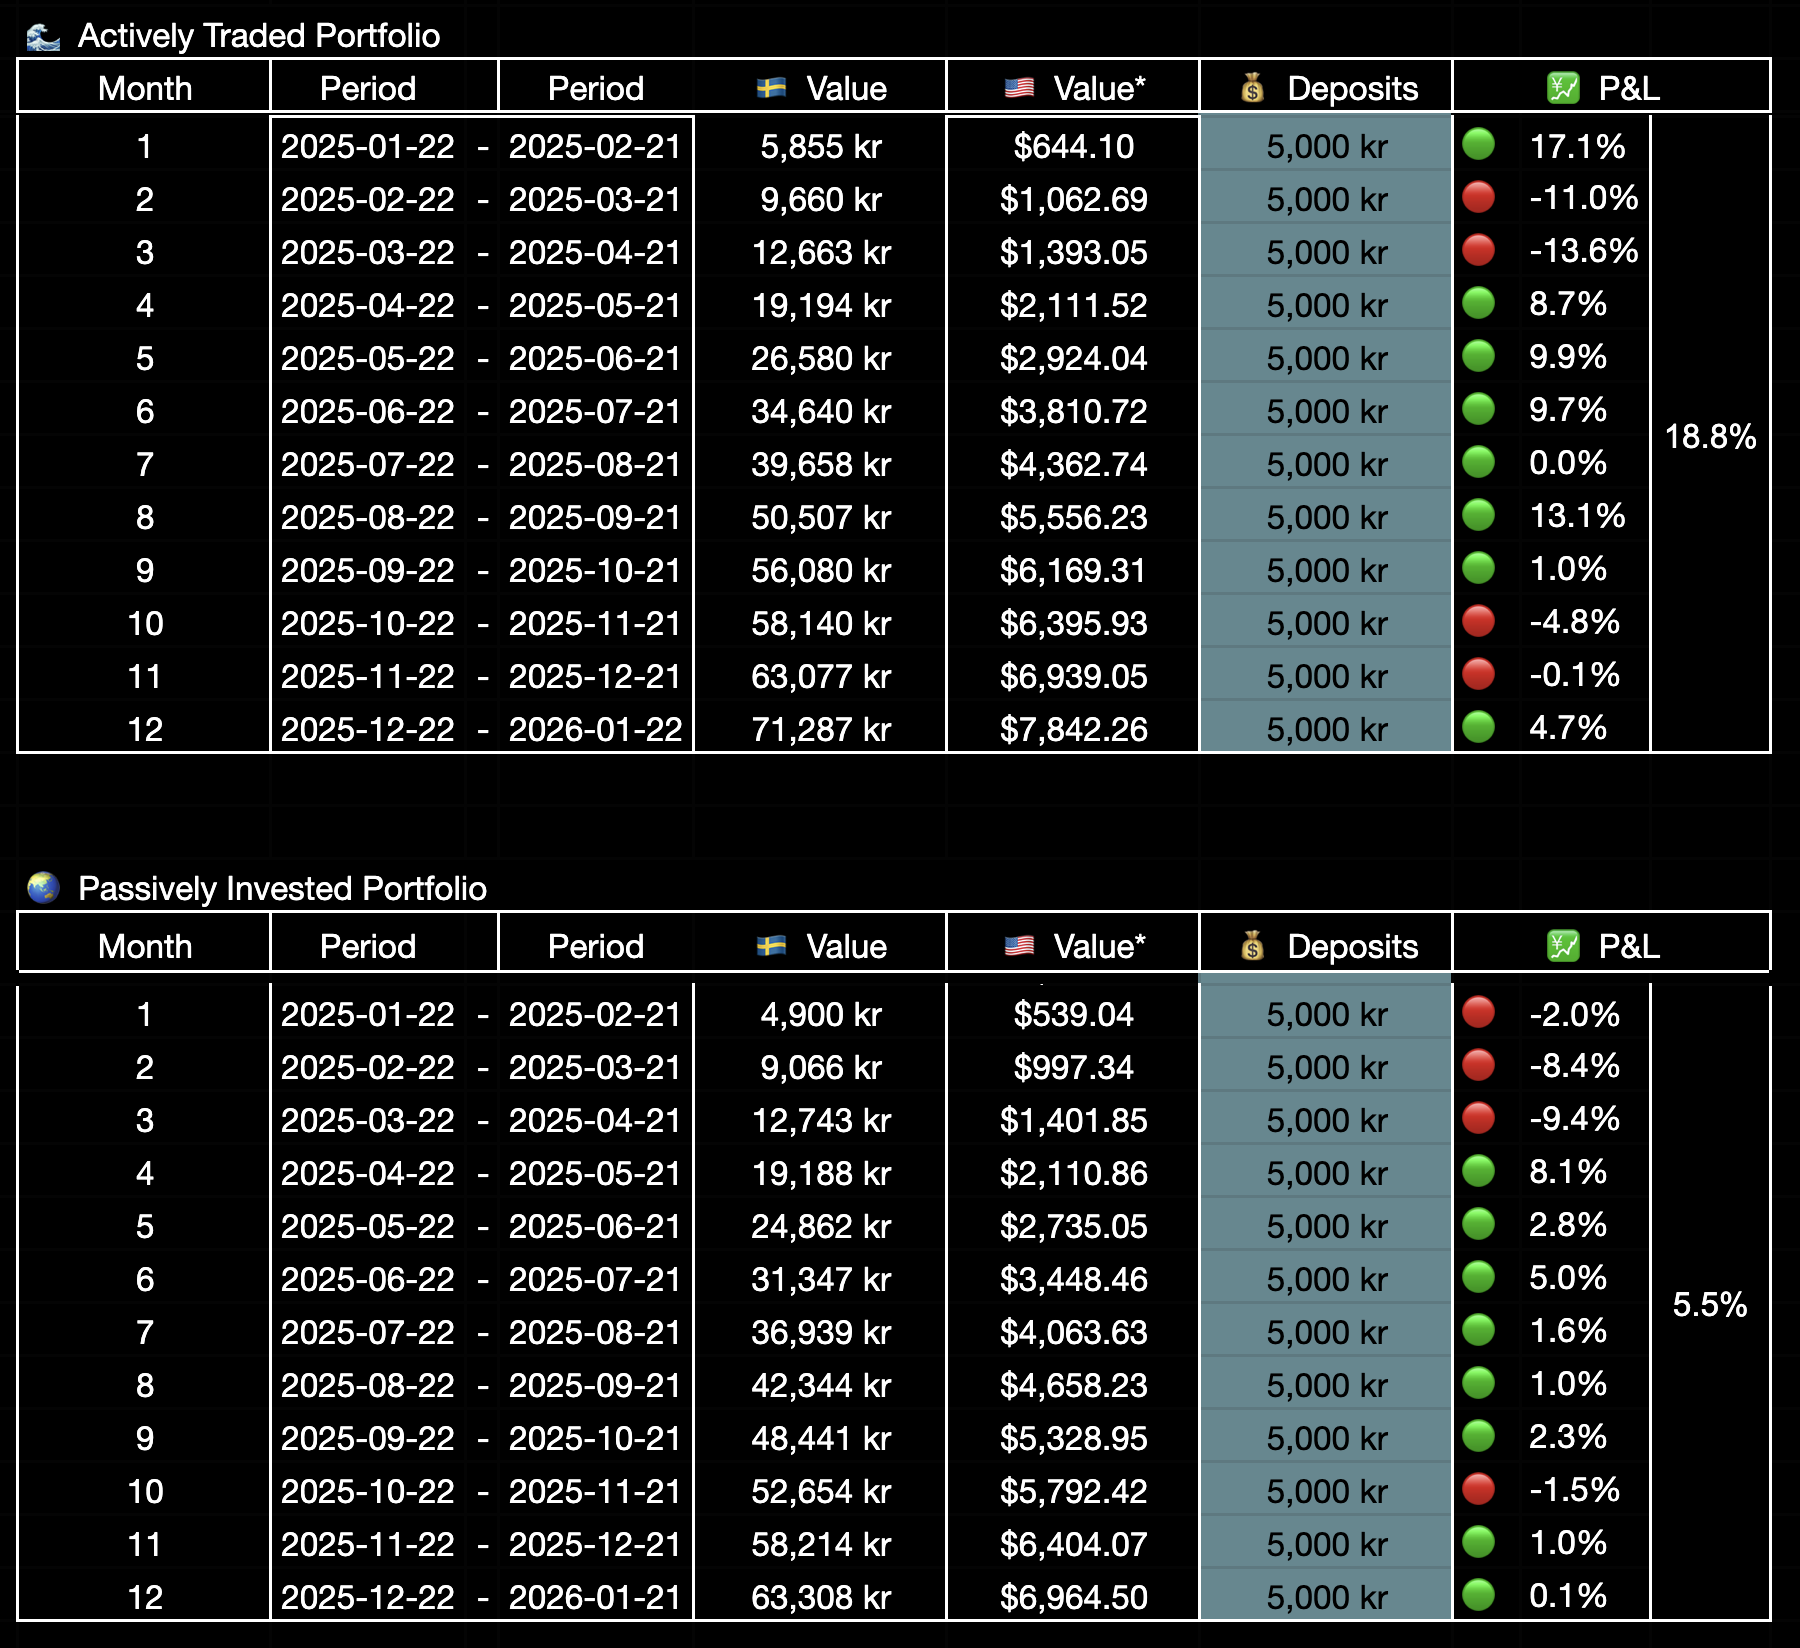 Performance: Month by Month, Table
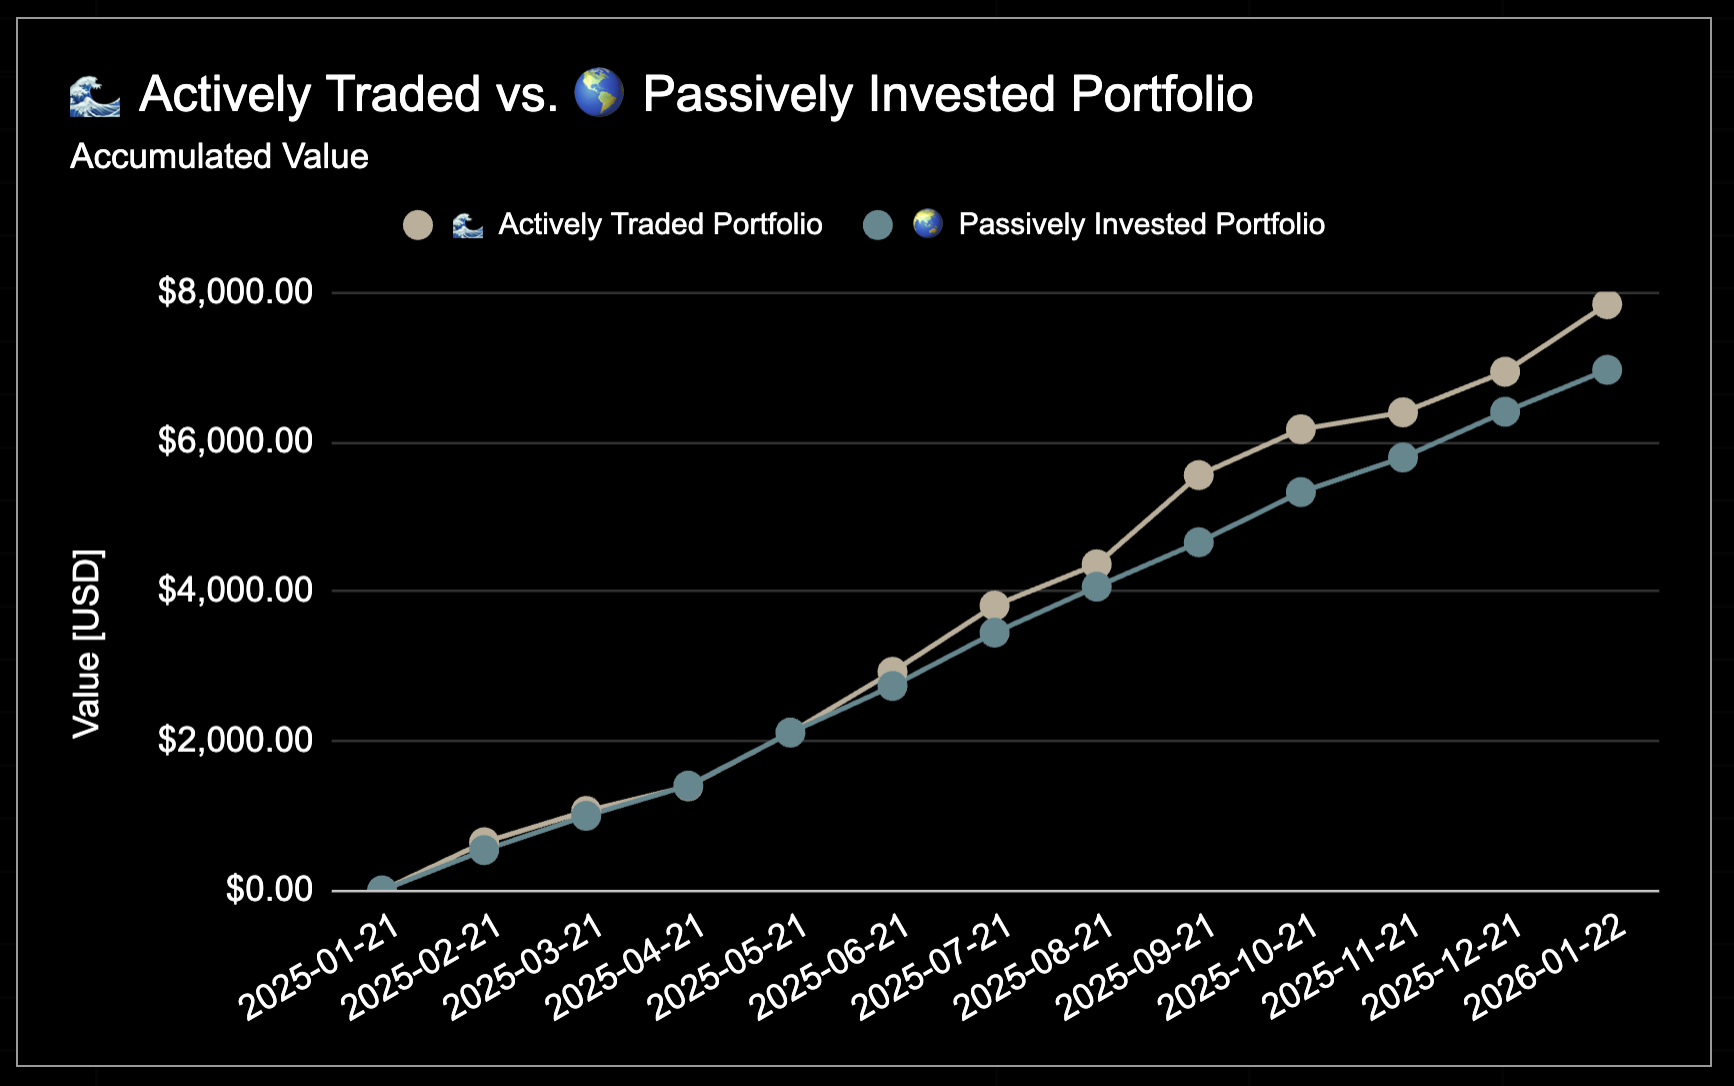 Performance: Month by Month, Chart
Open Positions
The portfolio currently consists of five open trades: $PYPL, $NOVO, $NOVO $JD and $TGT.
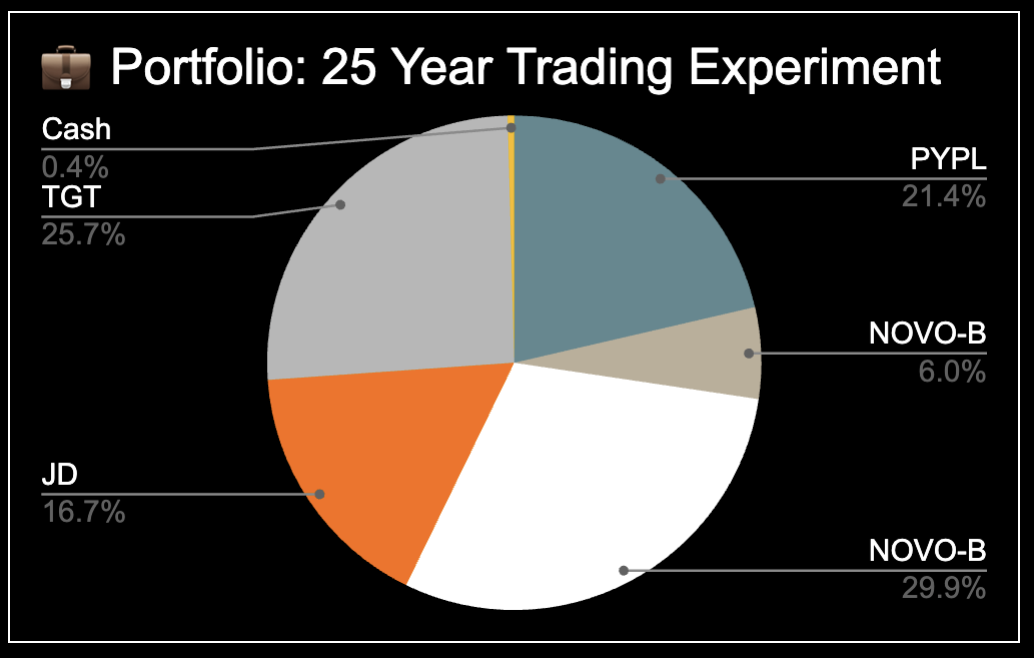 Open Positions
The total invested capital at risk is currently ⚠️ 21%, with the highest per-trade risk being 8% on $PYPL.
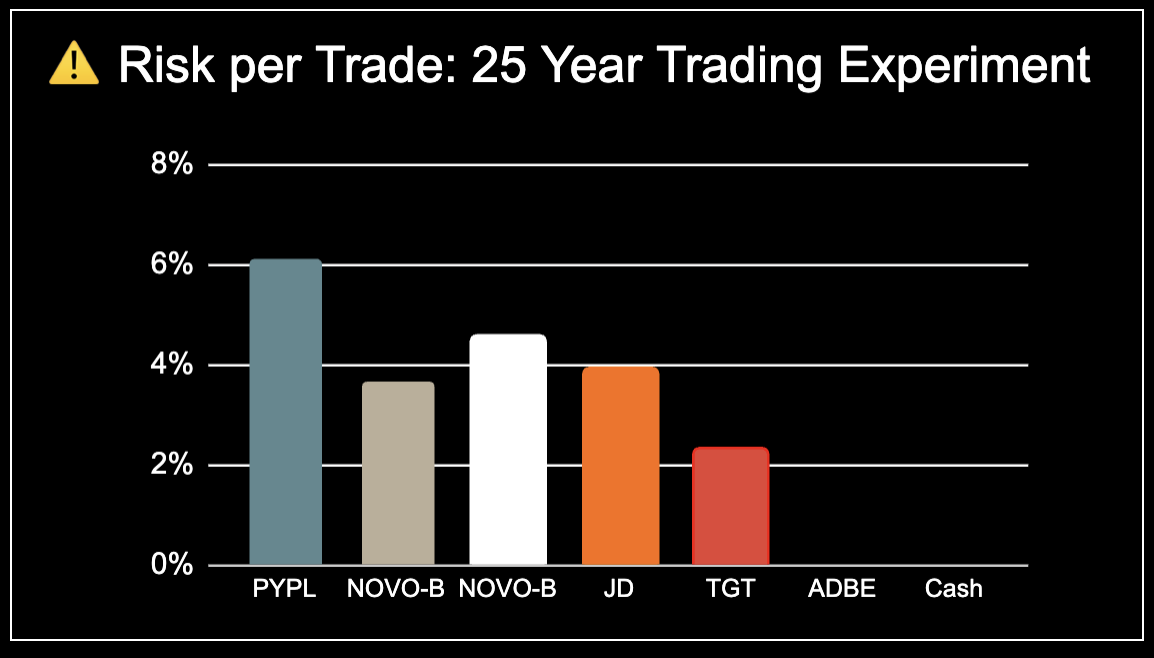 Risk per Trade
Open Positions: Detailed Overview
The following table contains the entry, stop loss, position size, and current market prices.
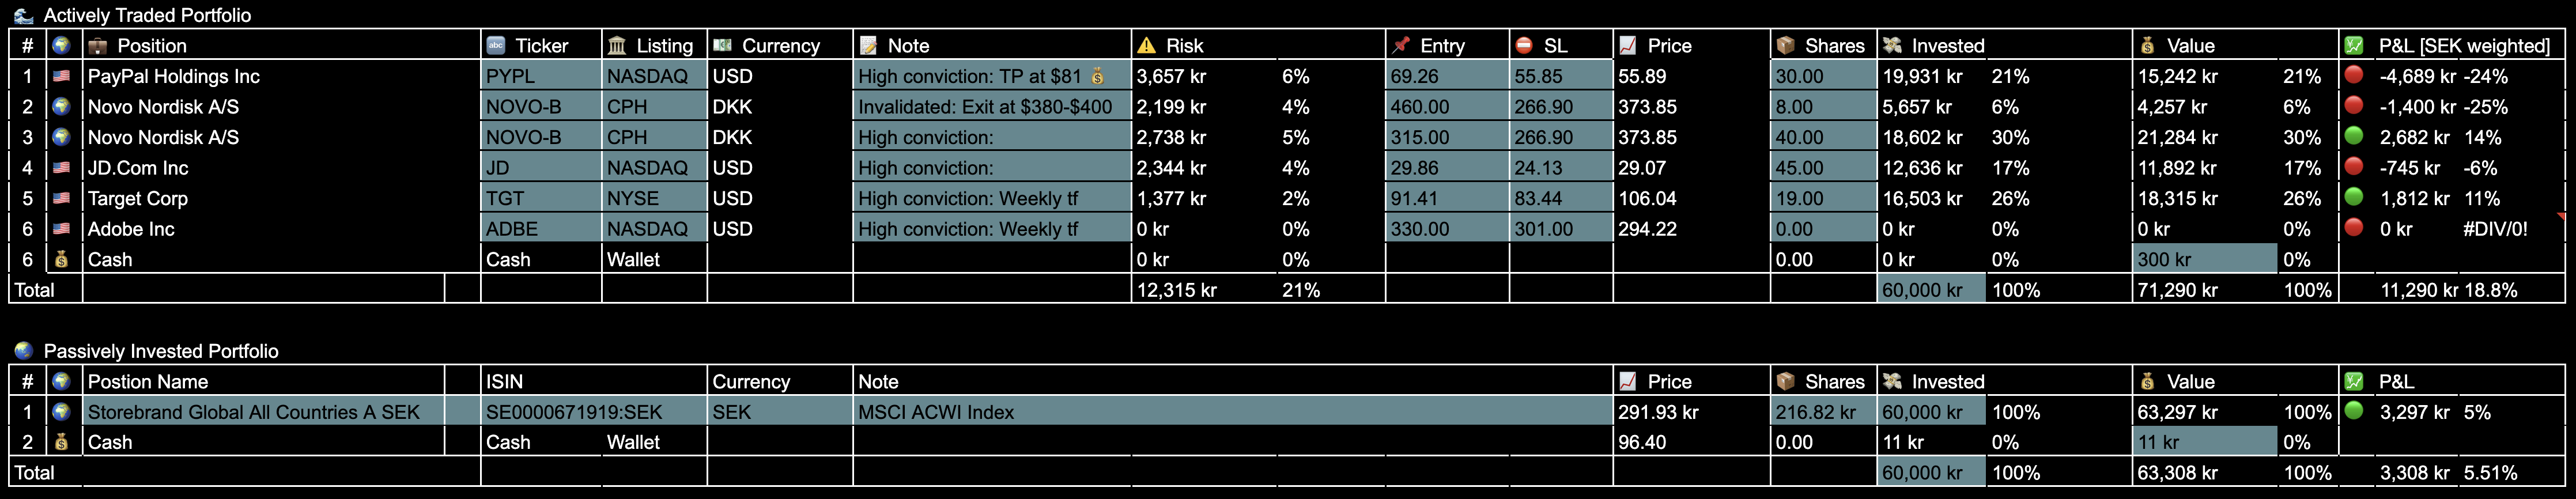 Open Trades: Details
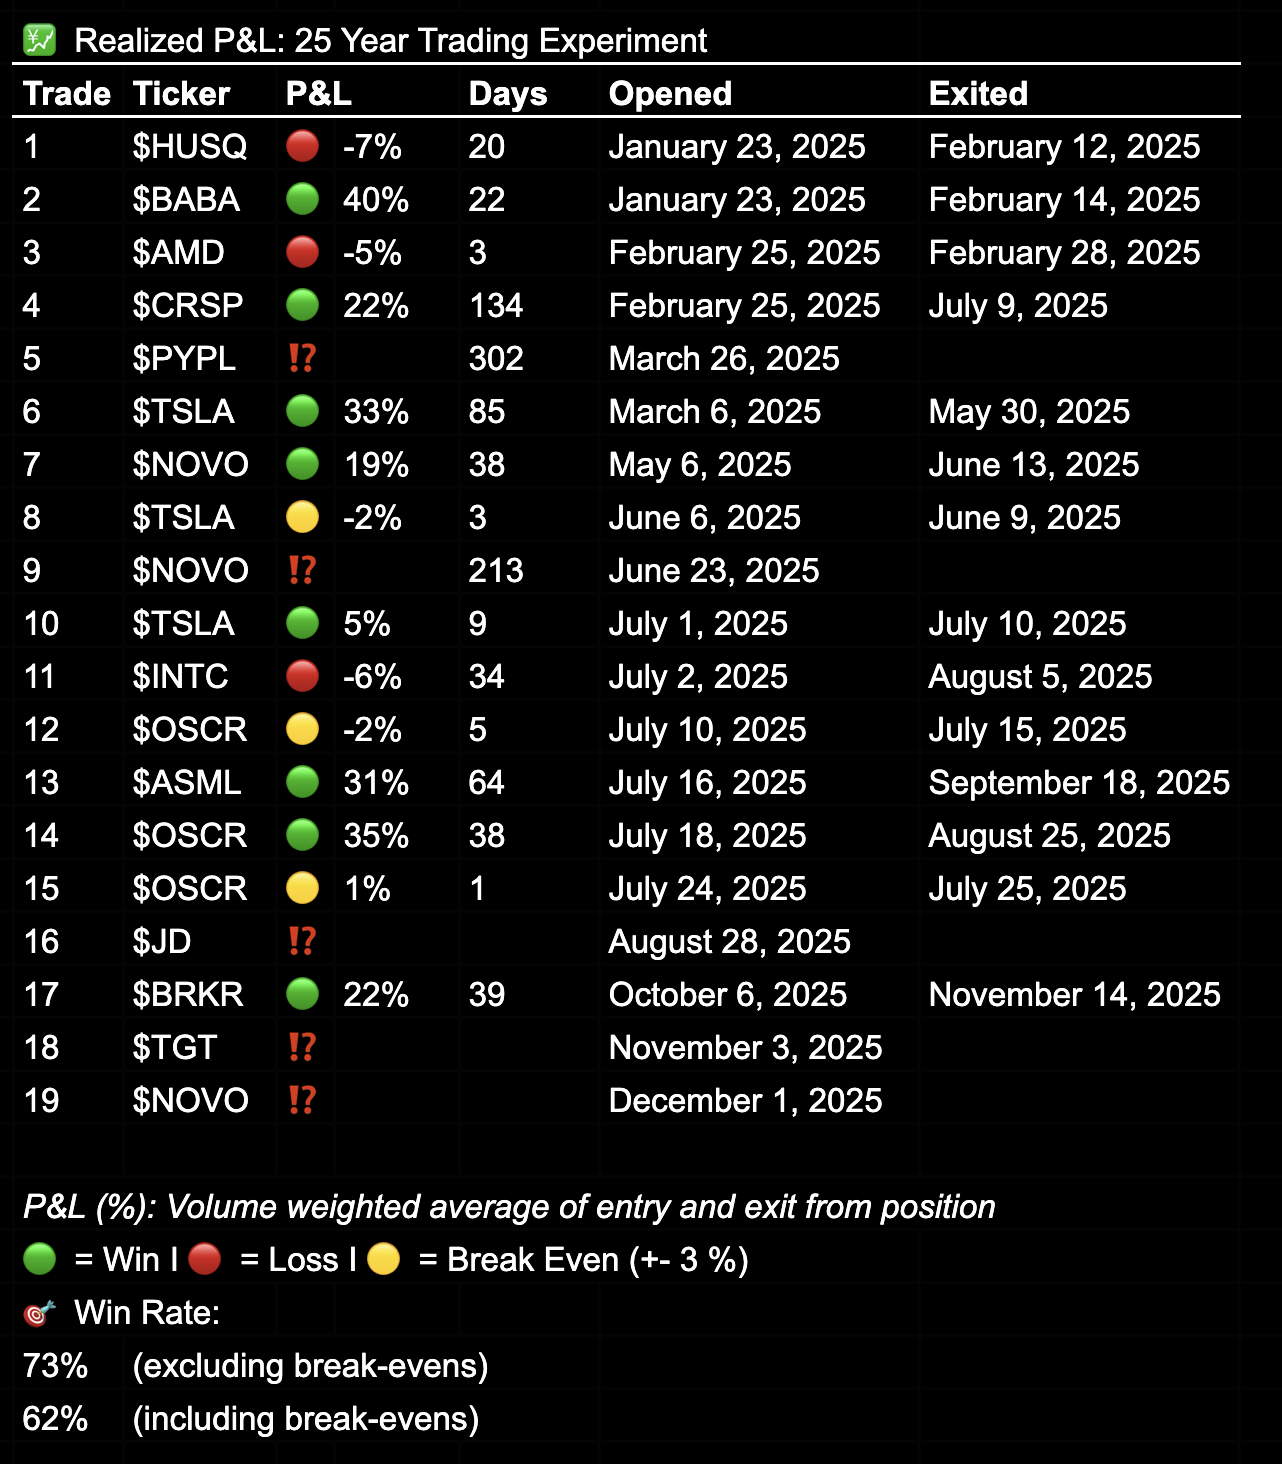
Realized P&L & Win Rate
Since inception, I have realized 14 trades:
- 🟢 8 Winners
- 🔴 3 Losses
- 🟡 3 Break-even (+/- 3%)
This translates to a 73% win rate when excluding break-even trades, or 62% including them. The top three trades, percentage-wise, have been $BABA, $TSLA, and $OSCR, each delivering between 31% and 40% from entry to exit.
Realized losses have so far been modest, with a maximum realized loss of just 7.2%. These results will change once I start realizing profit and loss for the open invalidated positions such as a massive drawback in a $NVO trade.
 Realized P&L
25 Year Trading Experiment
For a full overview of the experiment’s purpose and structure, check out my 25 Year overview page,, or watch the previously released YouTube introduction.
In short:
- 💰 10,000 SEK (~$1,000) invested monthly – split 50/50
- 🌊 Actively Traded vs 🌍 Passively Invested Global Index Fund
- 📅 Contributions on the 22nd of every month
- 🕰 Tracking my performance from 2025 to 2050
- 🌐 Transparency: Every trade shared publicly
Summary
I spend time on these monthly reviews for two main reasons.
First, they serve as a trading journal. Writing consistently helps me maintain a clear view of my long-term strategy, and reviewing progress on a monthly basis reinforces discipline and prevents me from drifting away from the broader objective. It’s a way to stay grounded, consistent, and continually remind myself that this approach is the right path forward.
Second, these updates allow me to share the journey publicly. By doing so, I create a layer of accountability that helps enforce my own process, while also offering transparency into what long-term, real-world trading actually looks like. If it inspires others to document their own journeys more openly and realistically, that’s an added bonus.
Are you satisfied with your performance past year?
💬 Share your thoughts on X or Substack — I’m always interested in connecting with like-minded people.