💼 Portfolio Update: 25 Year Trading Experiment | February 2026
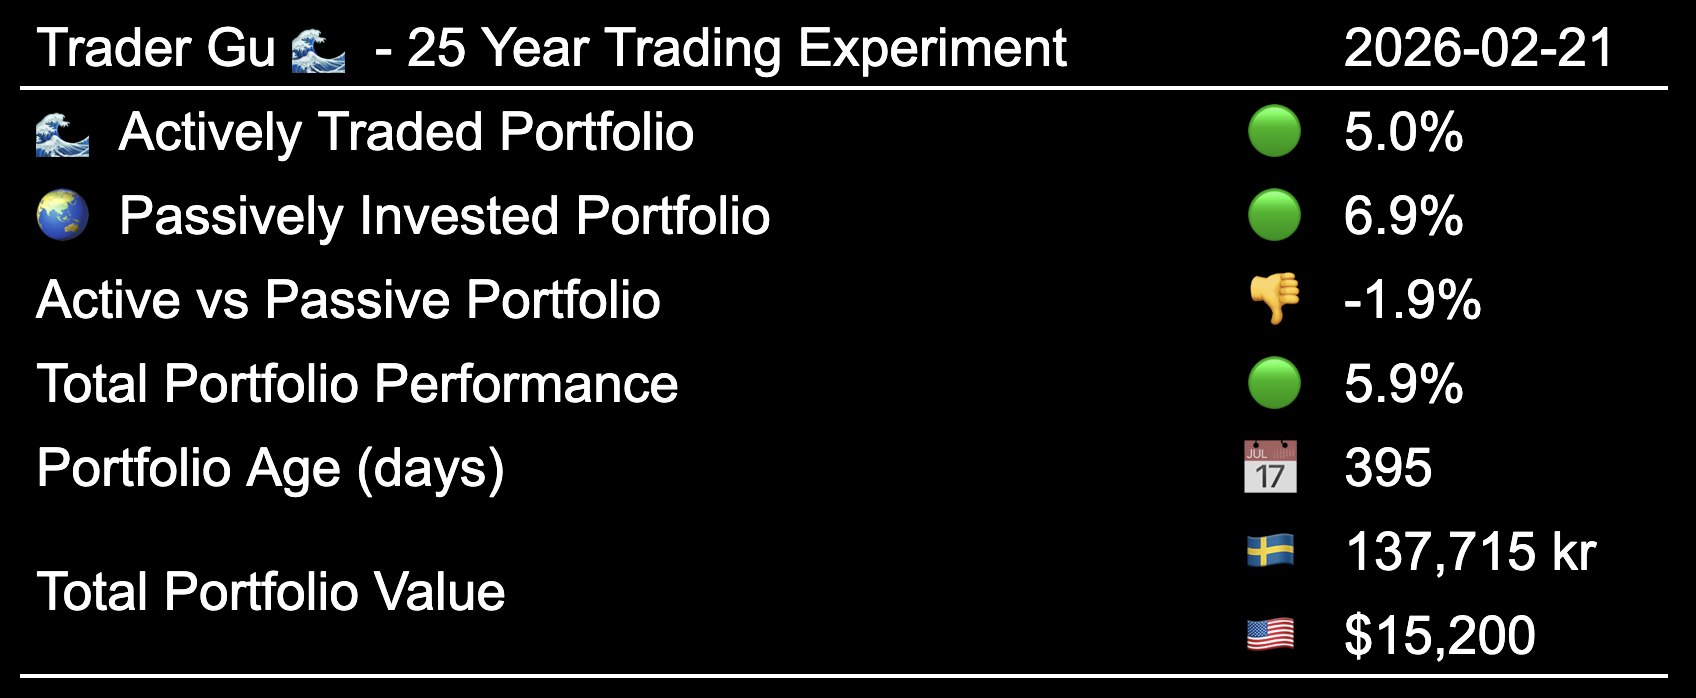
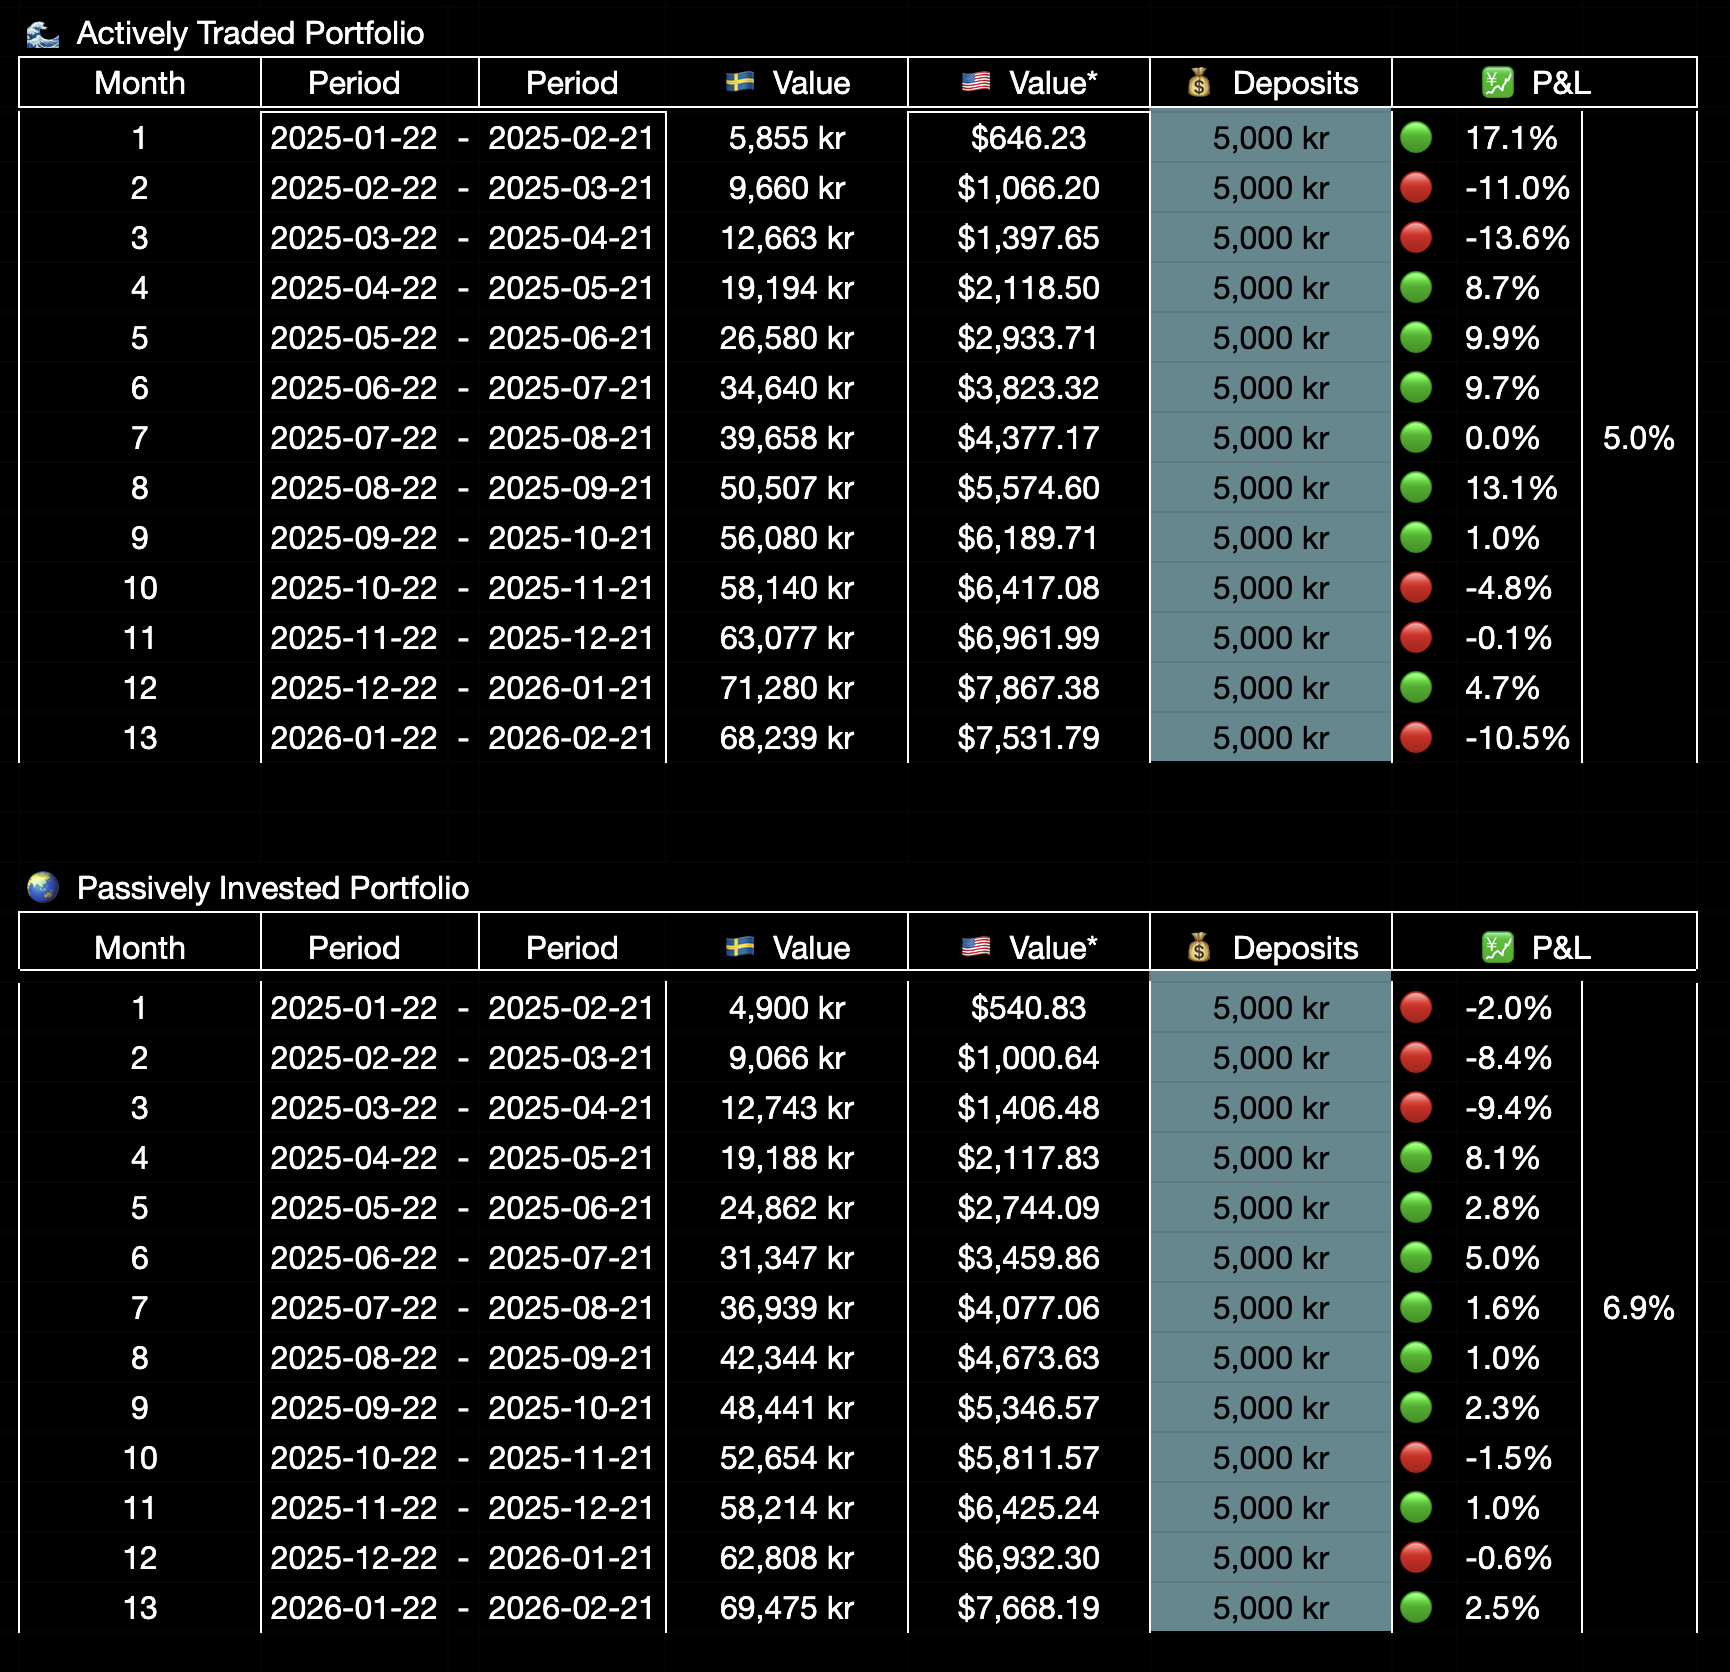
Month 13. The first month where the passively invested portfolio is outperforming the actively traded one on an inception-to-date basis. After a strong first year, February brought a -10.5% drawdown on the active side, driven by open positions moving against me while the passive portfolio held relatively steady. This is the reality of active trading - drawdowns happen, and how you respond to them matters more than the drawdown itself.
All trades are always shared live on X.com/tradergu, and the public trading dashboard is updated with the latest trade details and up-to-date portfolio allocations.
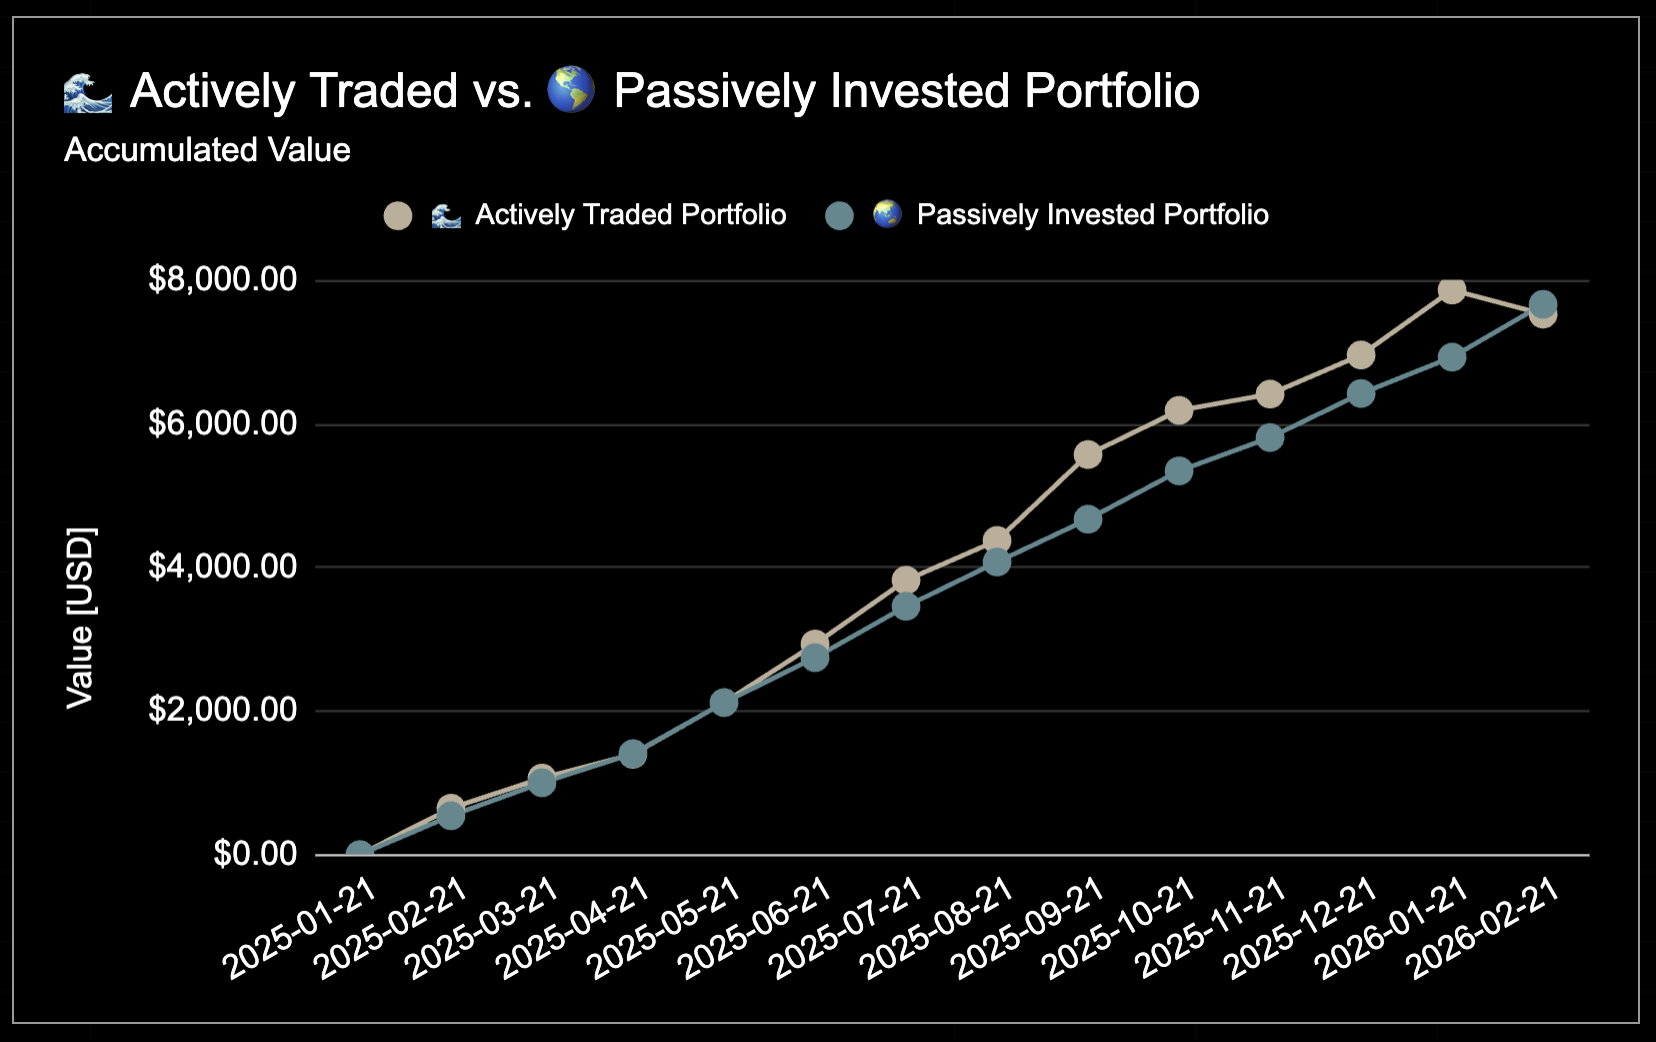
Performance: Inception to Date
The total portfolio value is now worth $15,200. Both portfolios are in profit, but for the first time, the Passively Invested Portfolio is ahead - outperforming the Actively Traded Portfolio by 1.9 percentage points from inception-to-date.
- Actively Traded Portfolio: 🟢 +5.0%
- Passively Invested Portfolio: 🟢 +6.9%
 Performance: Inception to Date
The goal is to outperform the global index over a 25 year period through disciplined active Swing Trading. {: .prompt-info }
Performance: Year to Date
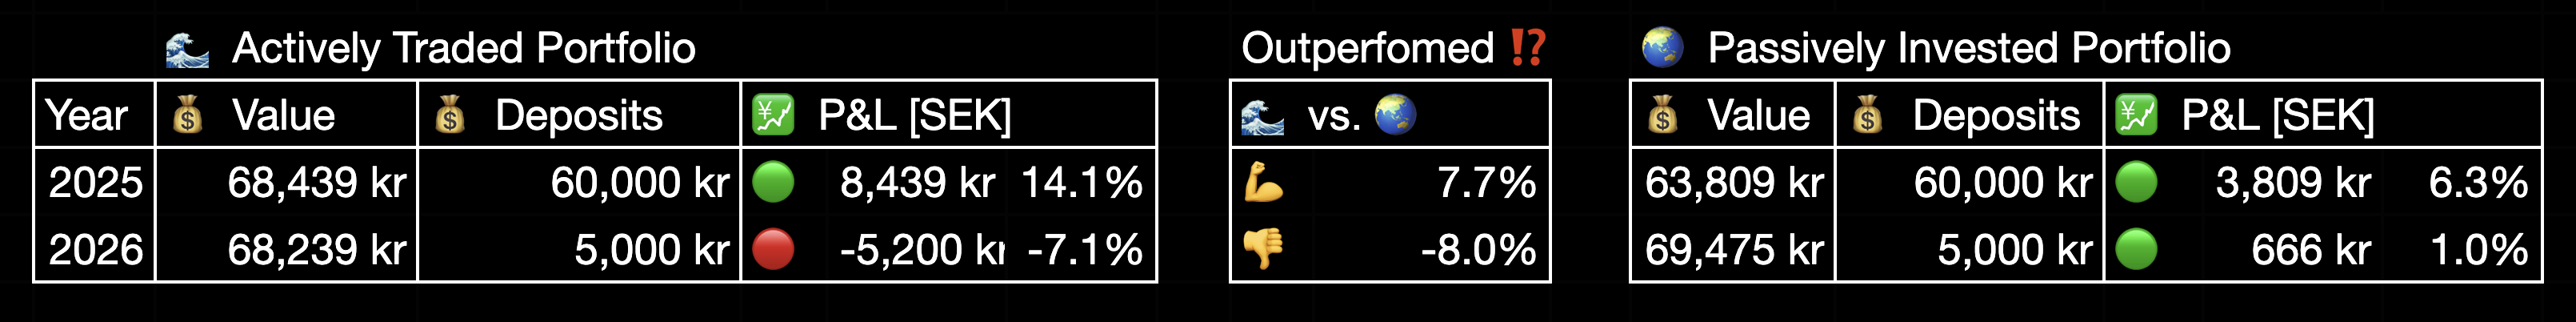
2026 has been a rough start for the active portfolio. The actively traded portfolio is down -7.1% year-to-date, while the passive side is slightly positive at +1.0%. That’s an 8.0 percentage point gap in favor of passive - the widest it’s been since inception.
- Actively Traded Portfolio: 🔴 -7.1%
- Passively Invested Portfolio: 🟢 +1.0%
 Performance: Year to Date
Performance: Month to Month Overview
Month 13 was the worst single month for the actively traded portfolio at -10.5%. The passive portfolio held up better, posting a modest +2.5% in the same period.
 Performance: Month by Month, Table
 Performance: Month by Month, Chart
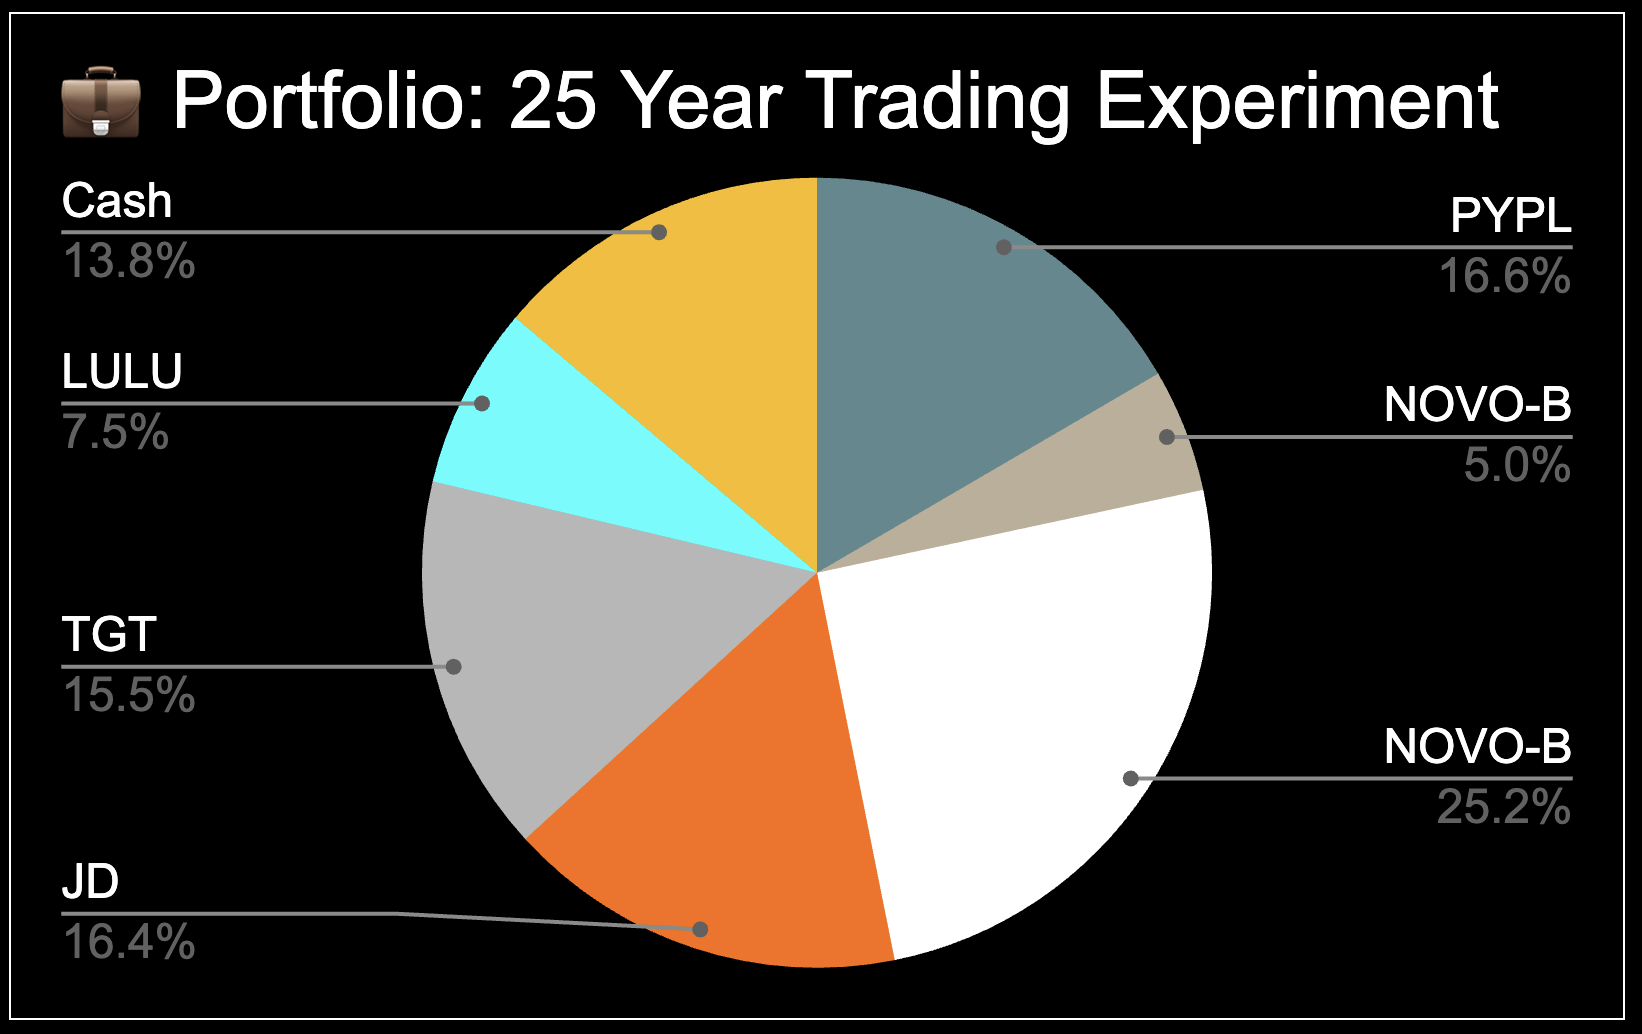
Open Positions
The portfolio currently consists of six open trades: $PYPL, $NOVO (x2), $JD, $TGT, and $LULU, with 13.8% in cash.
 Open Positions
The total invested capital at risk is currently ⚠️ 19%. Worth noting: the risk chart shows the calculated risk based on stop loss levels, but $PYPL gapped well below my stop loss, meaning the actual drawdown on that position is significantly larger than the planned risk. This is the primary driver behind the portfolio’s heavy drawdown this month.
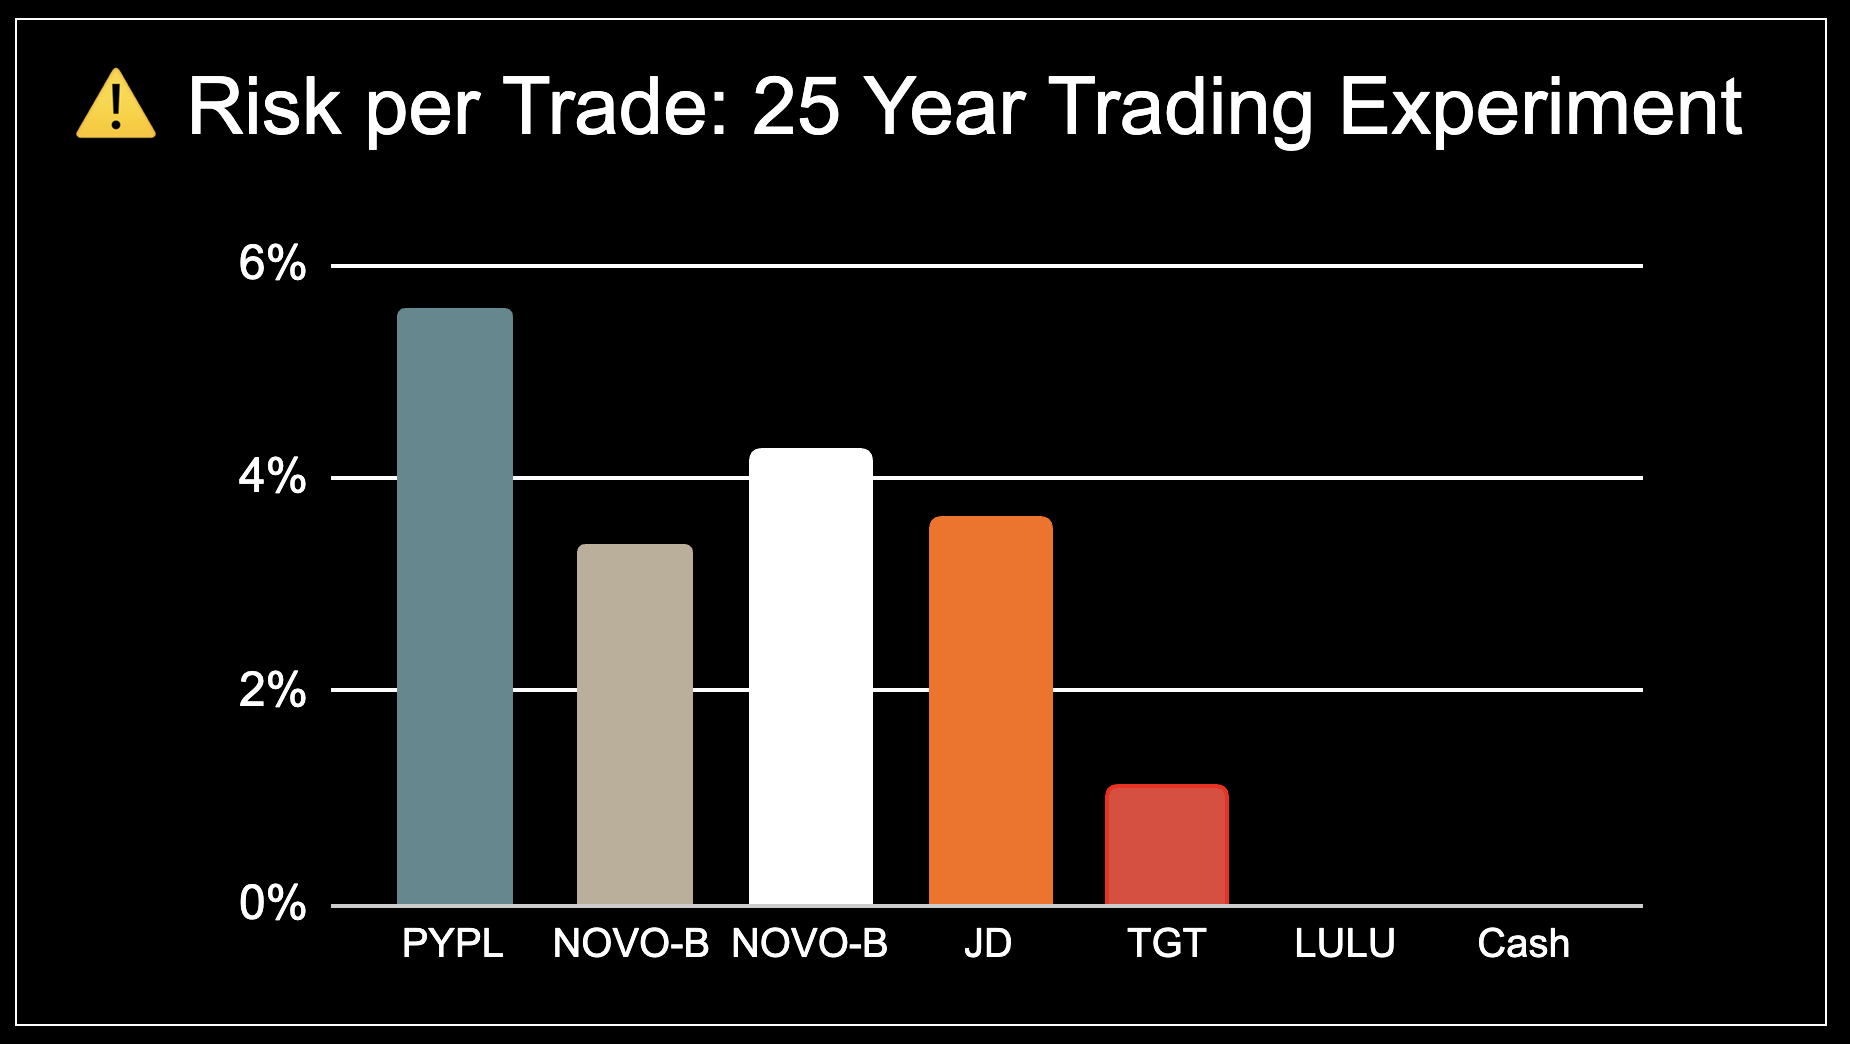 Risk per Trade
Open Positions: Detailed Overview
The following table contains the entry, stop loss, position size, and current market prices.
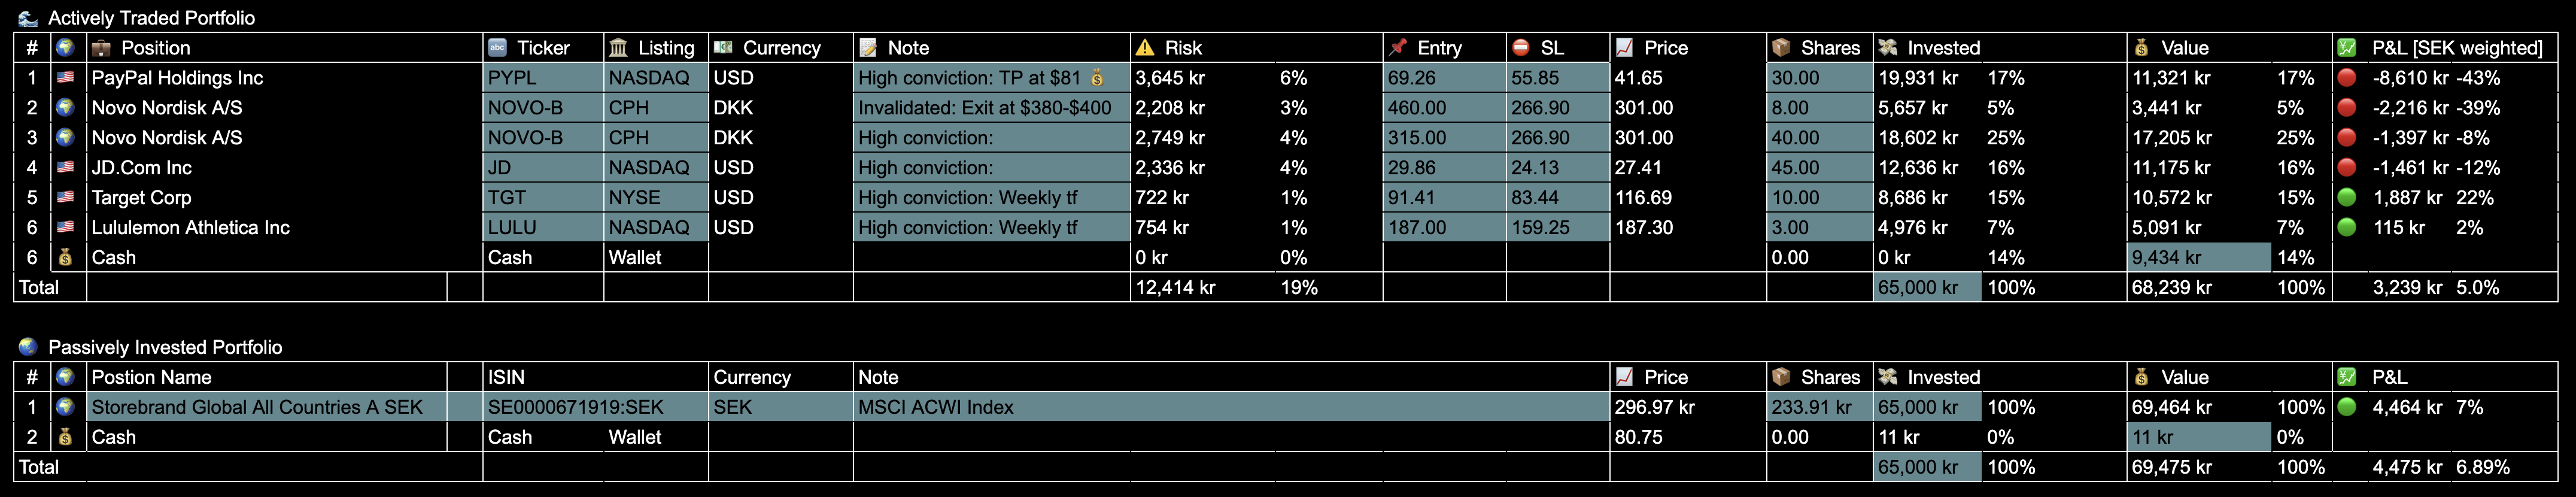 Open Trades: Details
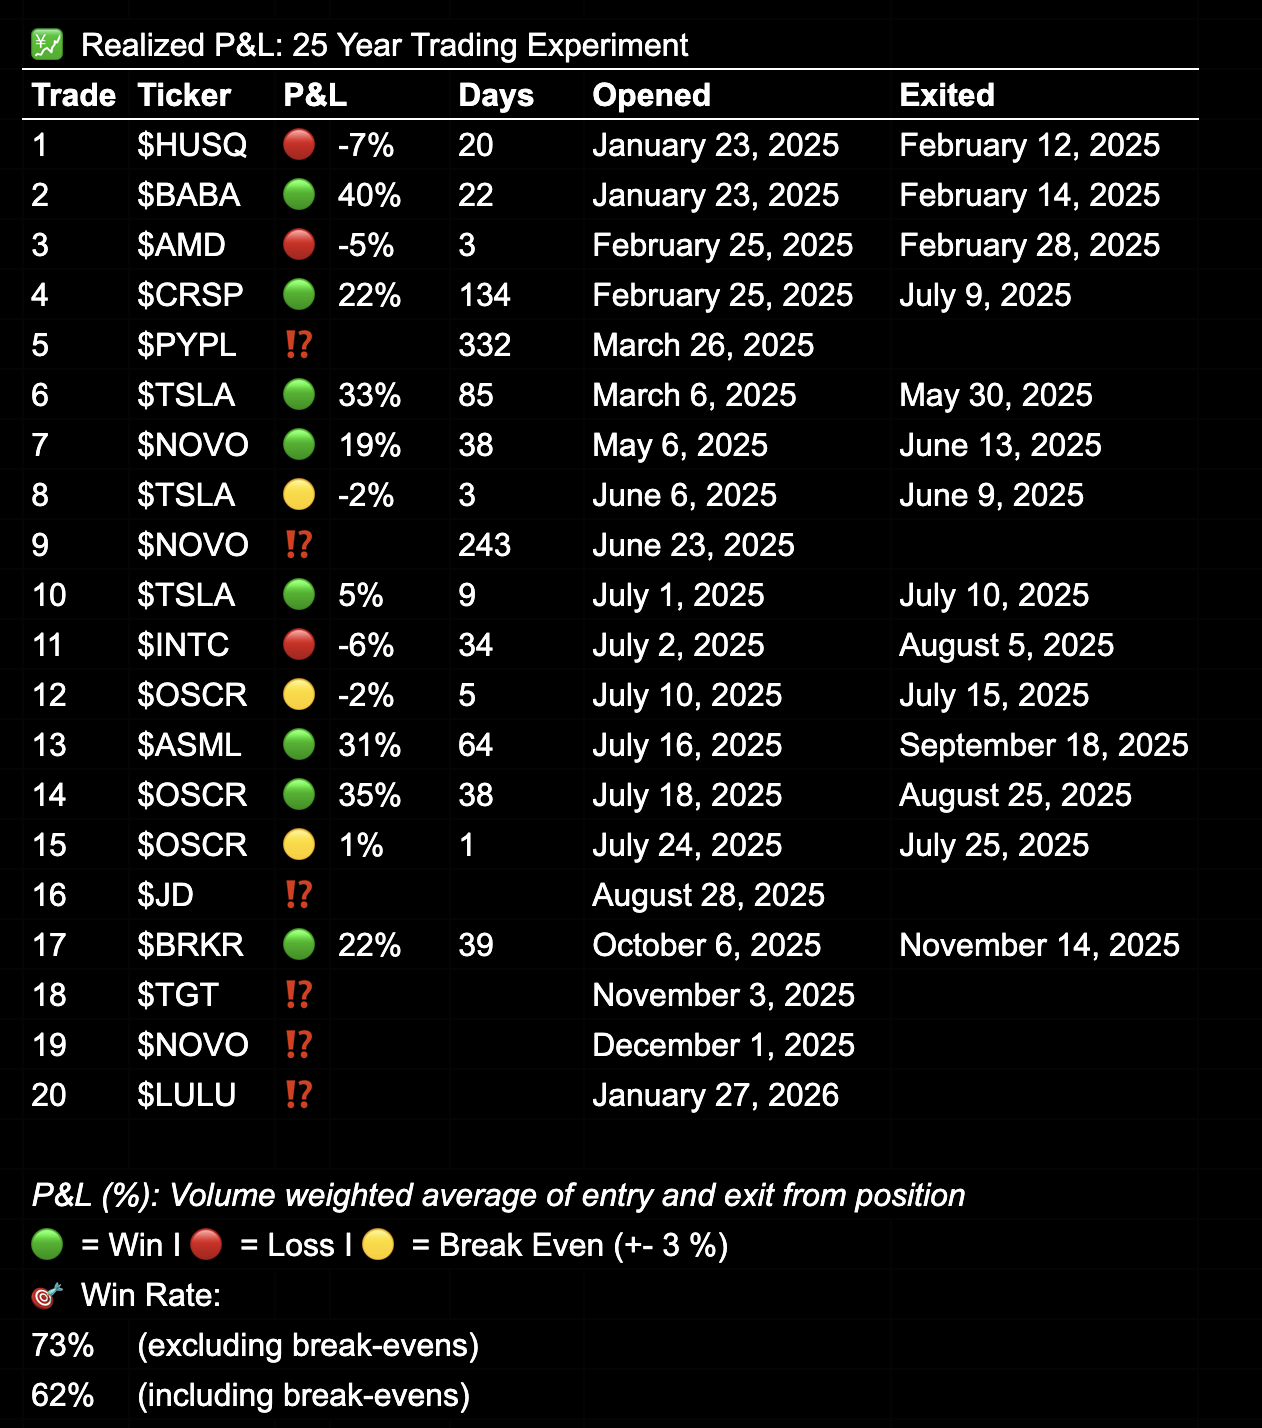
Realized P&L & Win Rate
Since inception, I have realized 20 trades:
- 🟢 8 Winners
- 🔴 3 Losses
- 🟡 3 Break-even (+/- 3%)
- 🔵 6 Pending exit (invalidated or TP reached)
This translates to a 73% win rate when excluding break-even trades, or 62% including them. The top three trades, percentage-wise, remain $BABA, $TSLA, and $OSCR, each delivering between 31% and 40% from entry to exit.
Note: I still have one invalidated $PYPL and one invalidated $NVO position that I have not yet realized. Once closed, these will bring down the win rate.
 Realized P&L
25 Year Trading Experiment
For a full overview of the experiment’s purpose and structure, check out my 25 Year overview page, or watch the previously released YouTube introduction.
In short:
- 💰 10,000 SEK (~$1,000) invested monthly - split 50/50
- 🌊 Actively Traded vs 🌍 Passively Invested Global Index Fund
- 📅 Contributions on the 22nd of every month
- 🕰 Tracking my performance from 2025 to 2050
- 🌐 Transparency: Every trade shared publicly
Summary
Months like this are exactly why I document the journey publicly. It would be easy to only share the months where I’m outperforming, but that wouldn’t be honest. The passive portfolio is ahead for the first time, and that’s fine. This experiment is 25 years long, and I’m 13 months in.
What matters now is sticking to the process. The drawdown is driven by open positions that haven’t hit their stop losses, which means the setups are still valid. If they get stopped out, I take the loss and move on. If they recover and reach their targets, this month becomes a footnote.
Either way, the plan doesn’t change.
How are your portfolios holding up this month?
💬 Share your thoughts on X or Substack - I’m always interested in connecting with like-minded people.