💼 Portfolio Update: 25 Year Trading Experiment | August 2025
The summer has come to an end and it’s been 7 months since starting my 25 Year Trading Experiment. Both the weather and the equity market have been volatile and it’s time for the monthly portfolio update.
All trades are always shared live on X.com/tradergu, and the public trading dashboard is always updated with the latest trade details and up-to-date portfolio allocations.
Performance: Year to Date
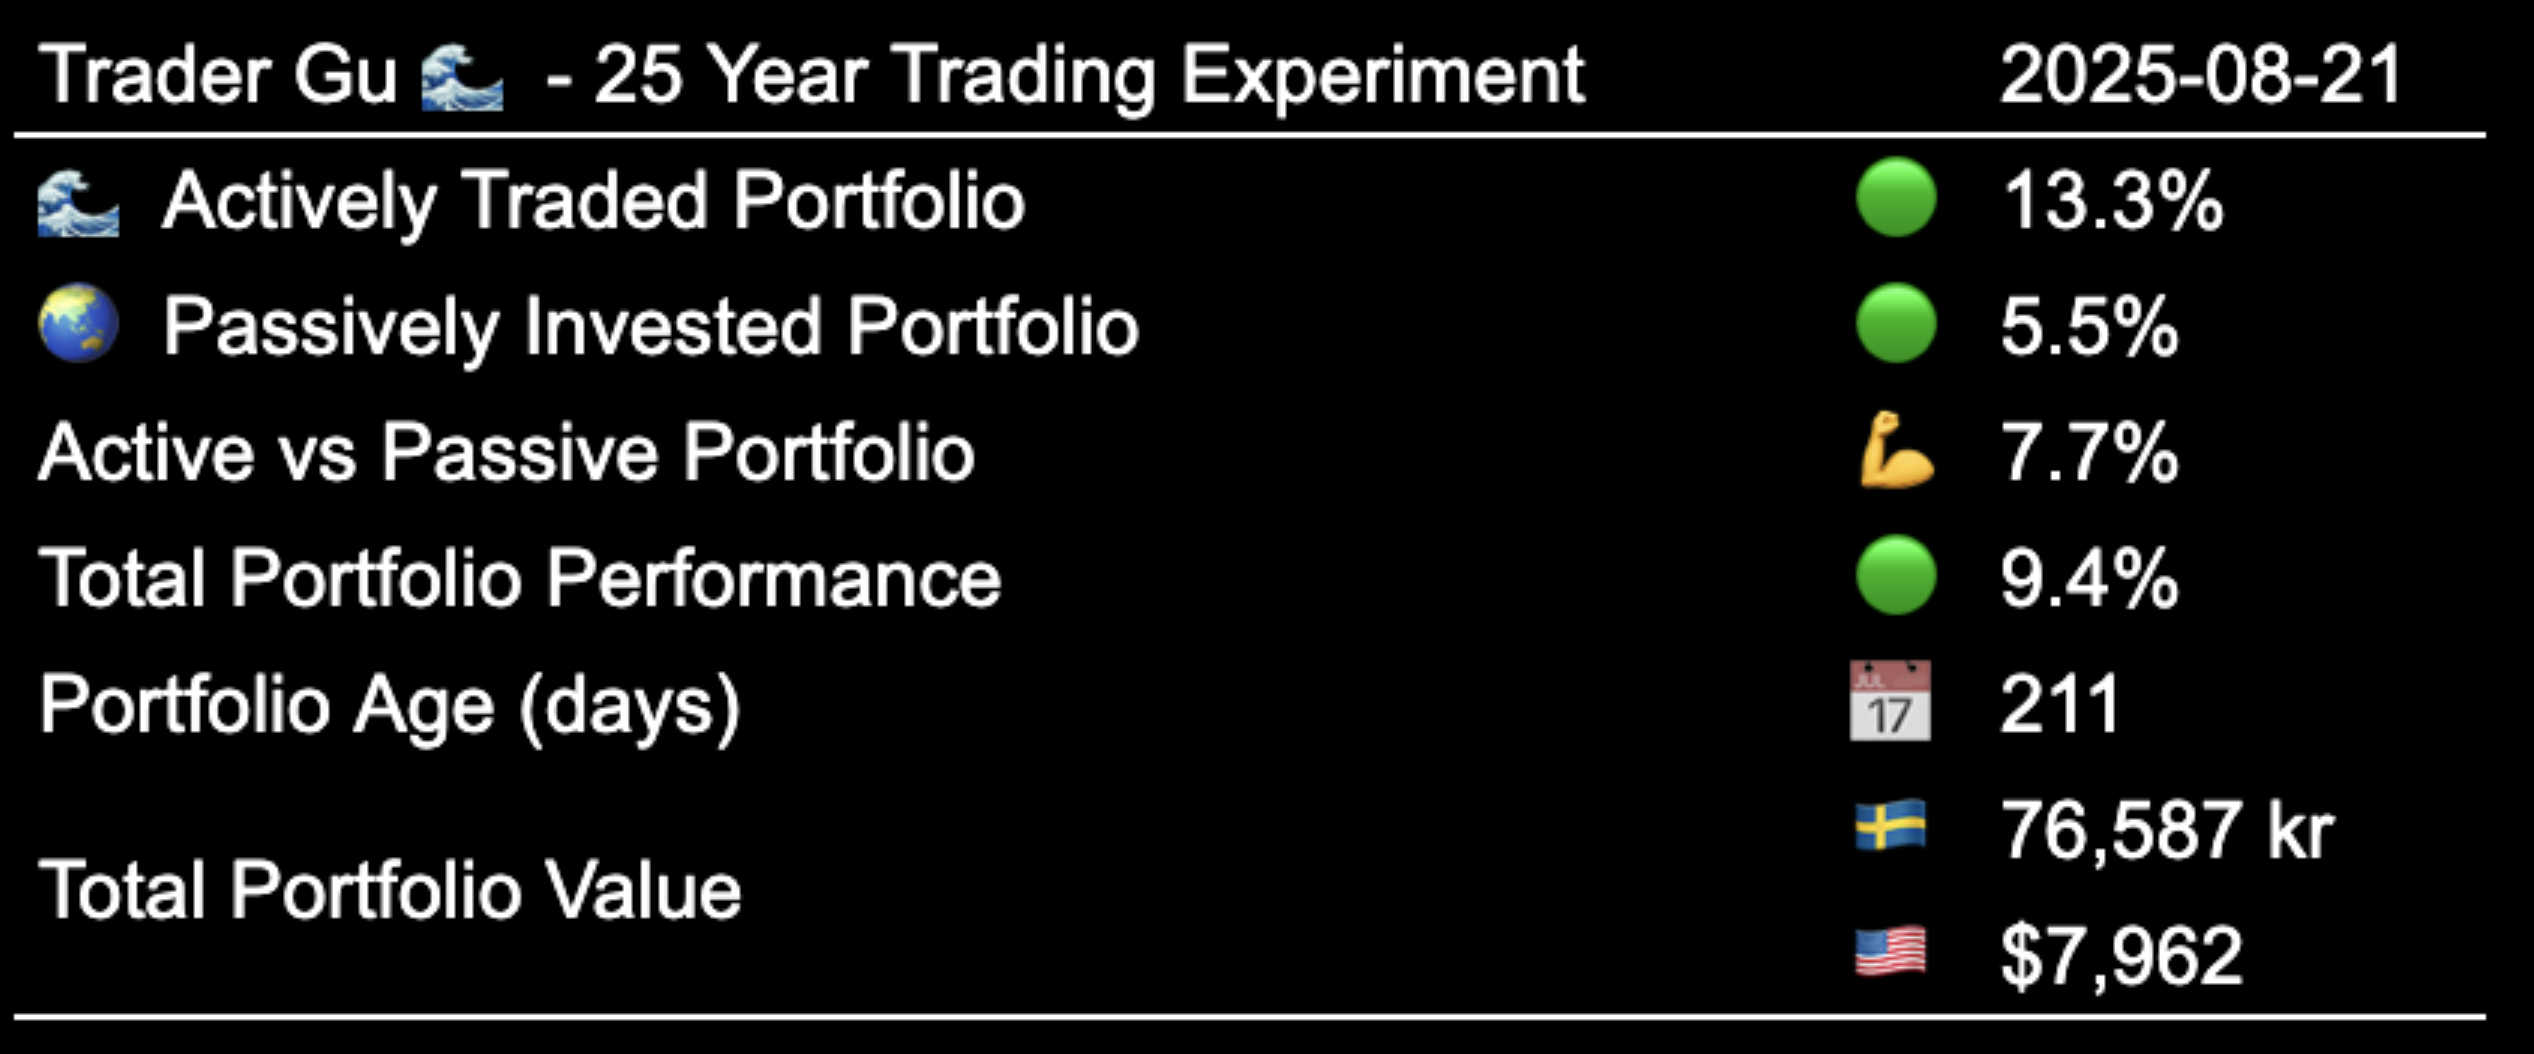
Both portfolios are in profit, and the Actively Traded Portfolio has outperformed the Passively Invested Portfolio by 💪 7.7 percentage points year to date.
- Actively Traded Portfolio: 🟢 +13.3%
- Passively Invested Portfolio: 🟢 5.5%
 Performance: Year to Date
Performance: Month to Month Overview
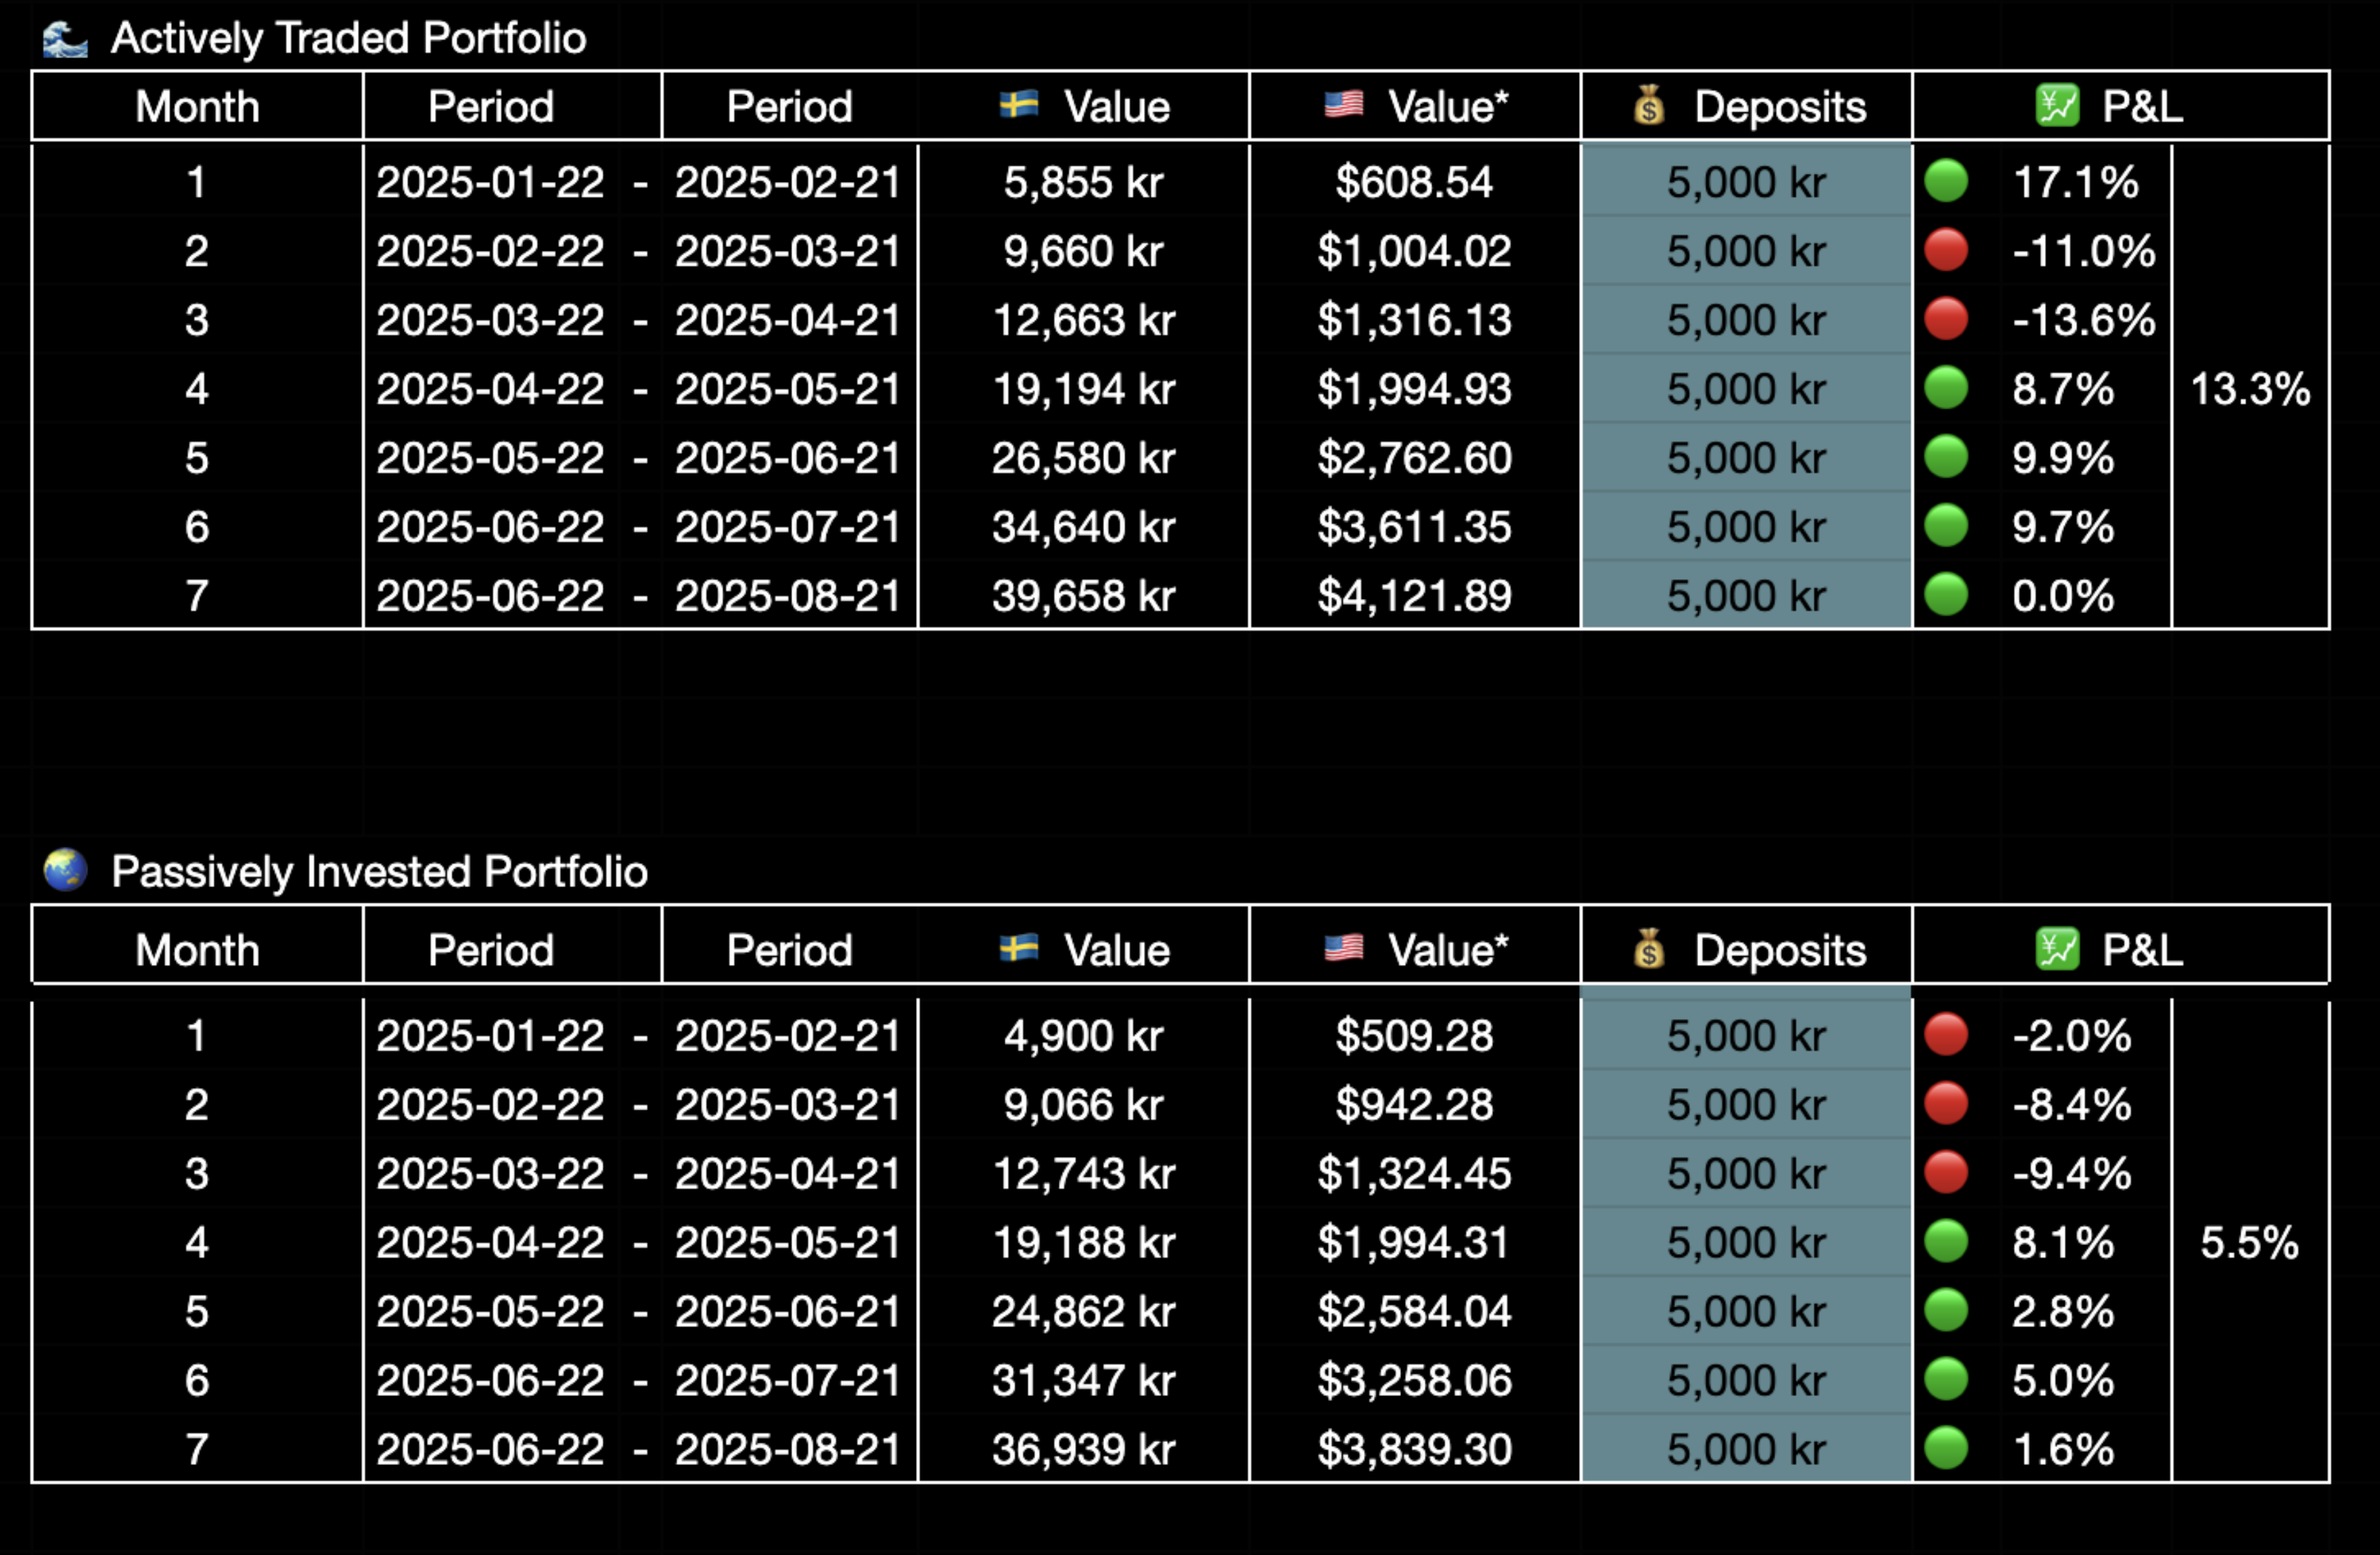
On a month-to-month perspective, the Actively Traded Portfolio has outperformed the Passively Invested Portfolio 5 out of 7 months, or 70% of the time.
The Actively Traded Portfolio performance has been flat due to a significant drawdown on my new $NOVO trade, whereas the Passively Invested Portfolio has outperformed with a total of 1.6% gain.
 Performance: Month by Month, Table
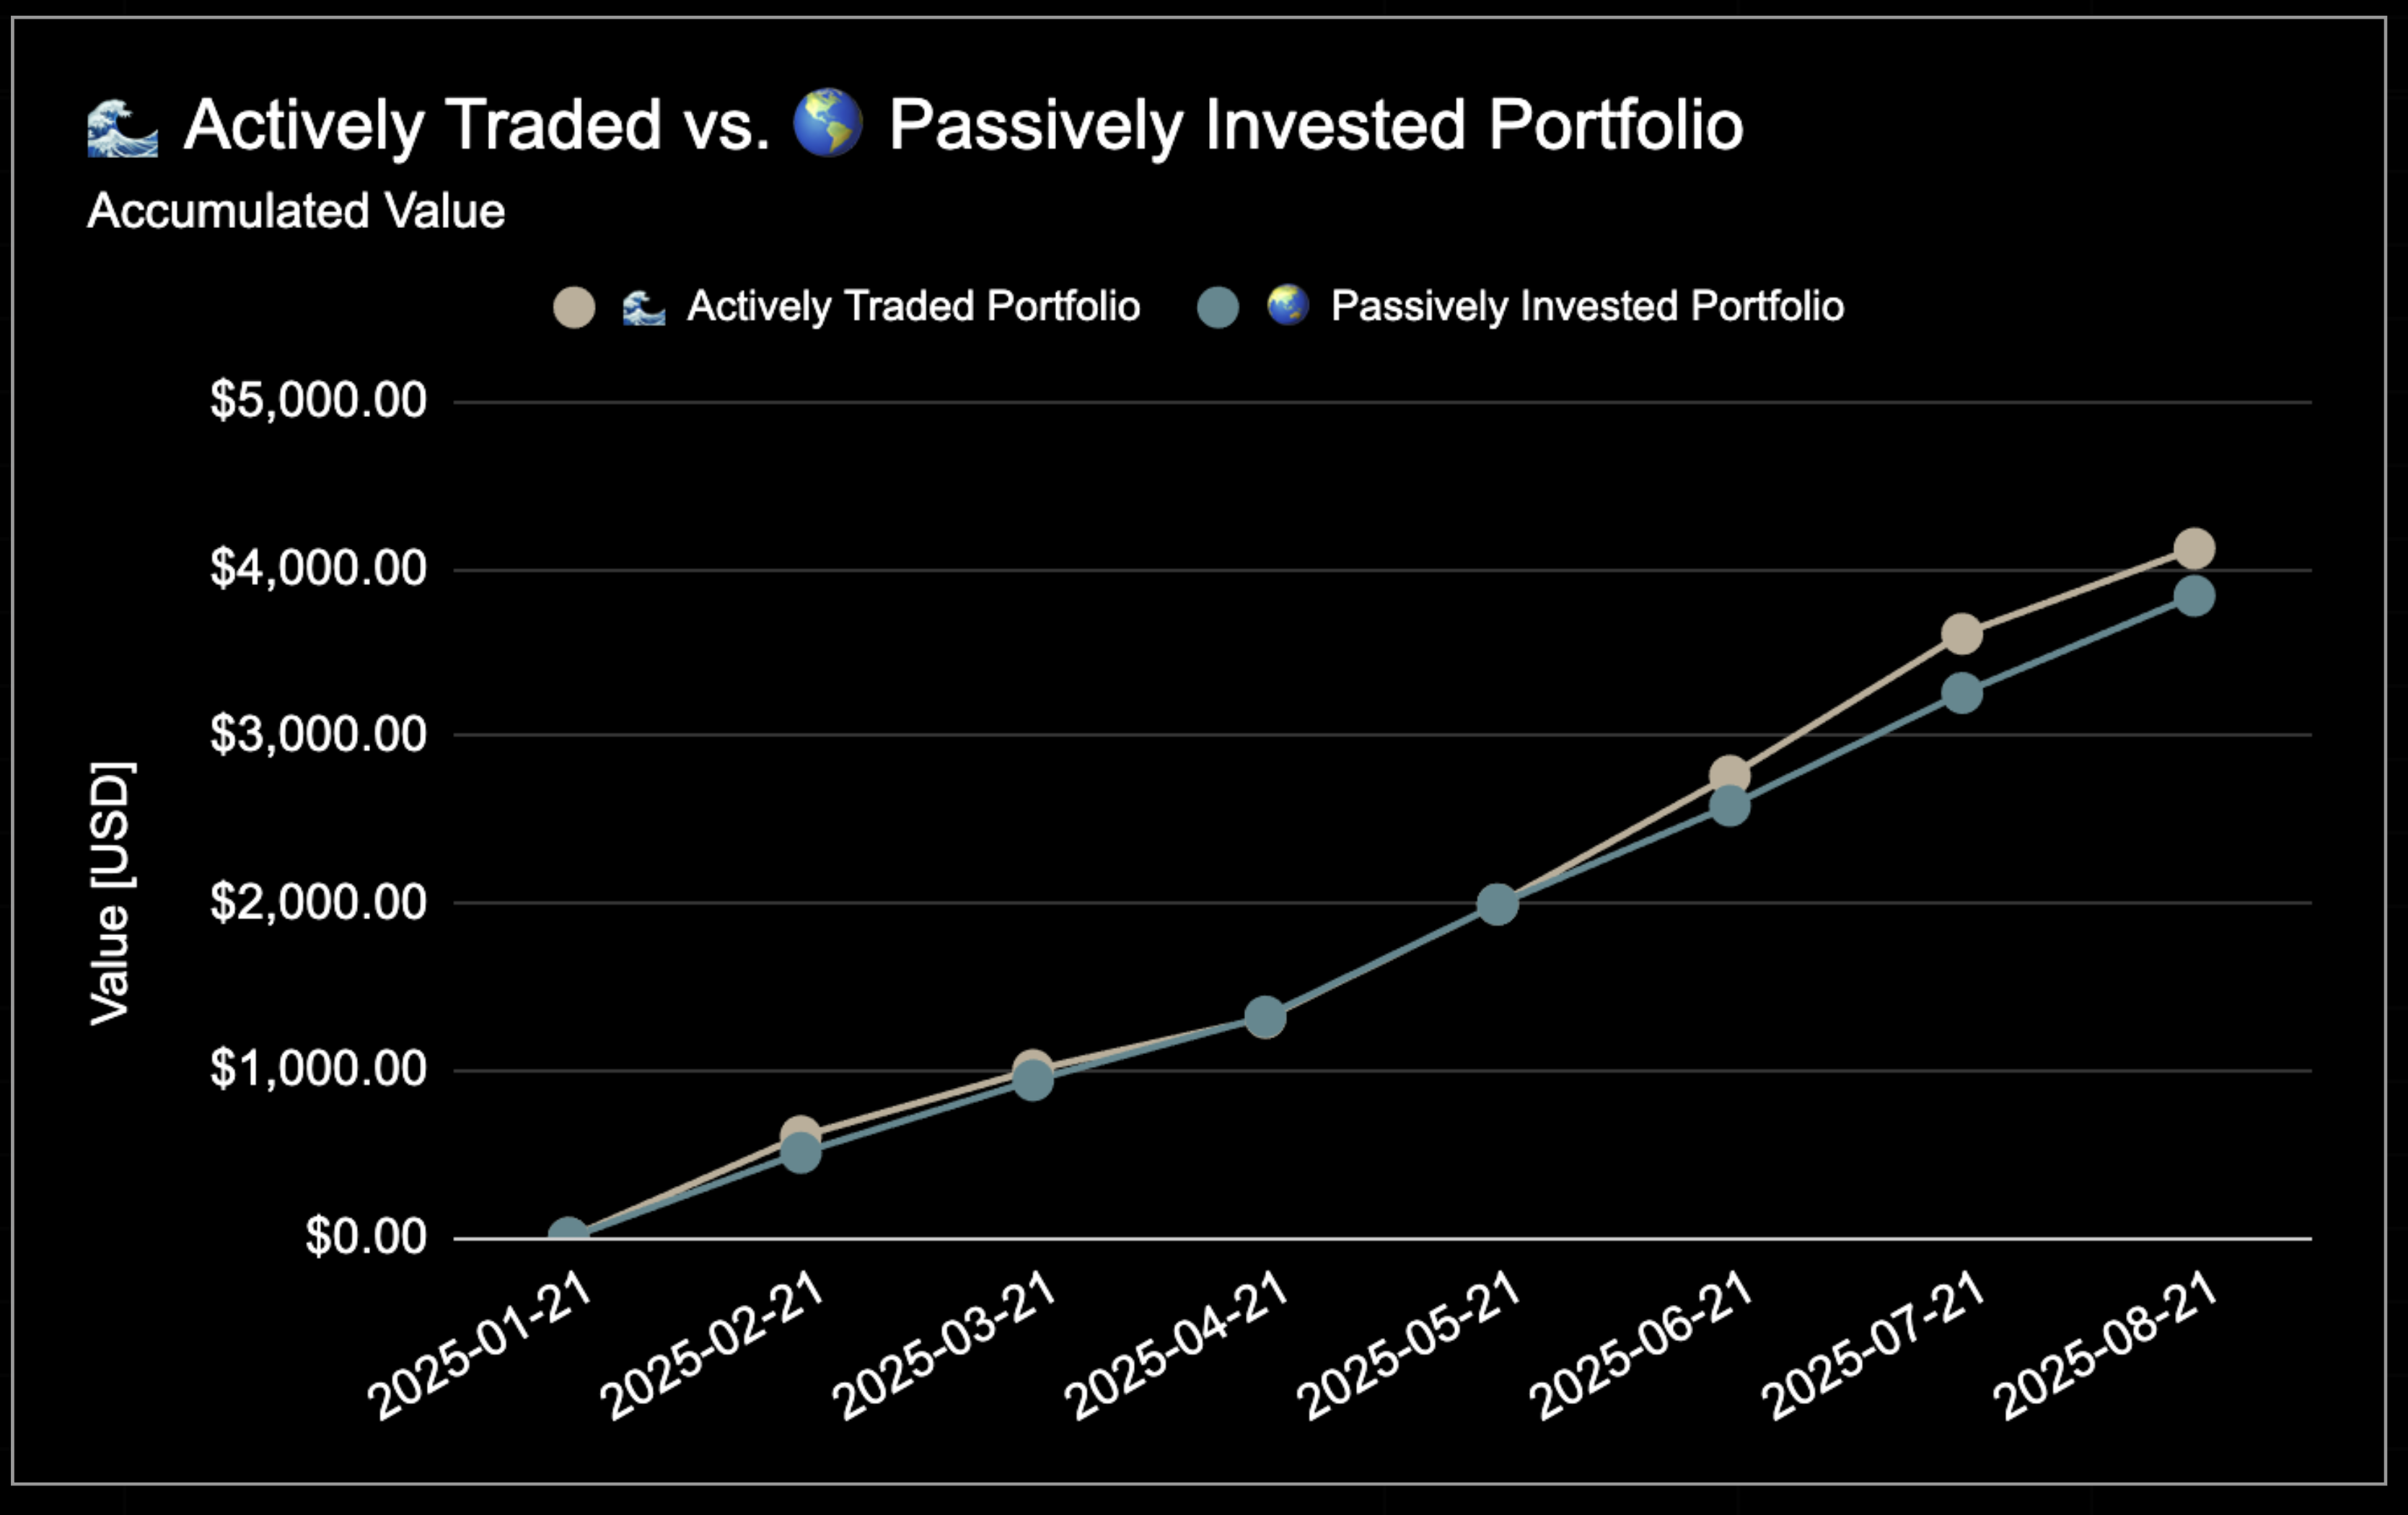 Performance: Month by Month, Chart
Open Positions
The portfolio currently consists of 4 open positions: $PYPL, $NOVO, $ASML and $OSCR.
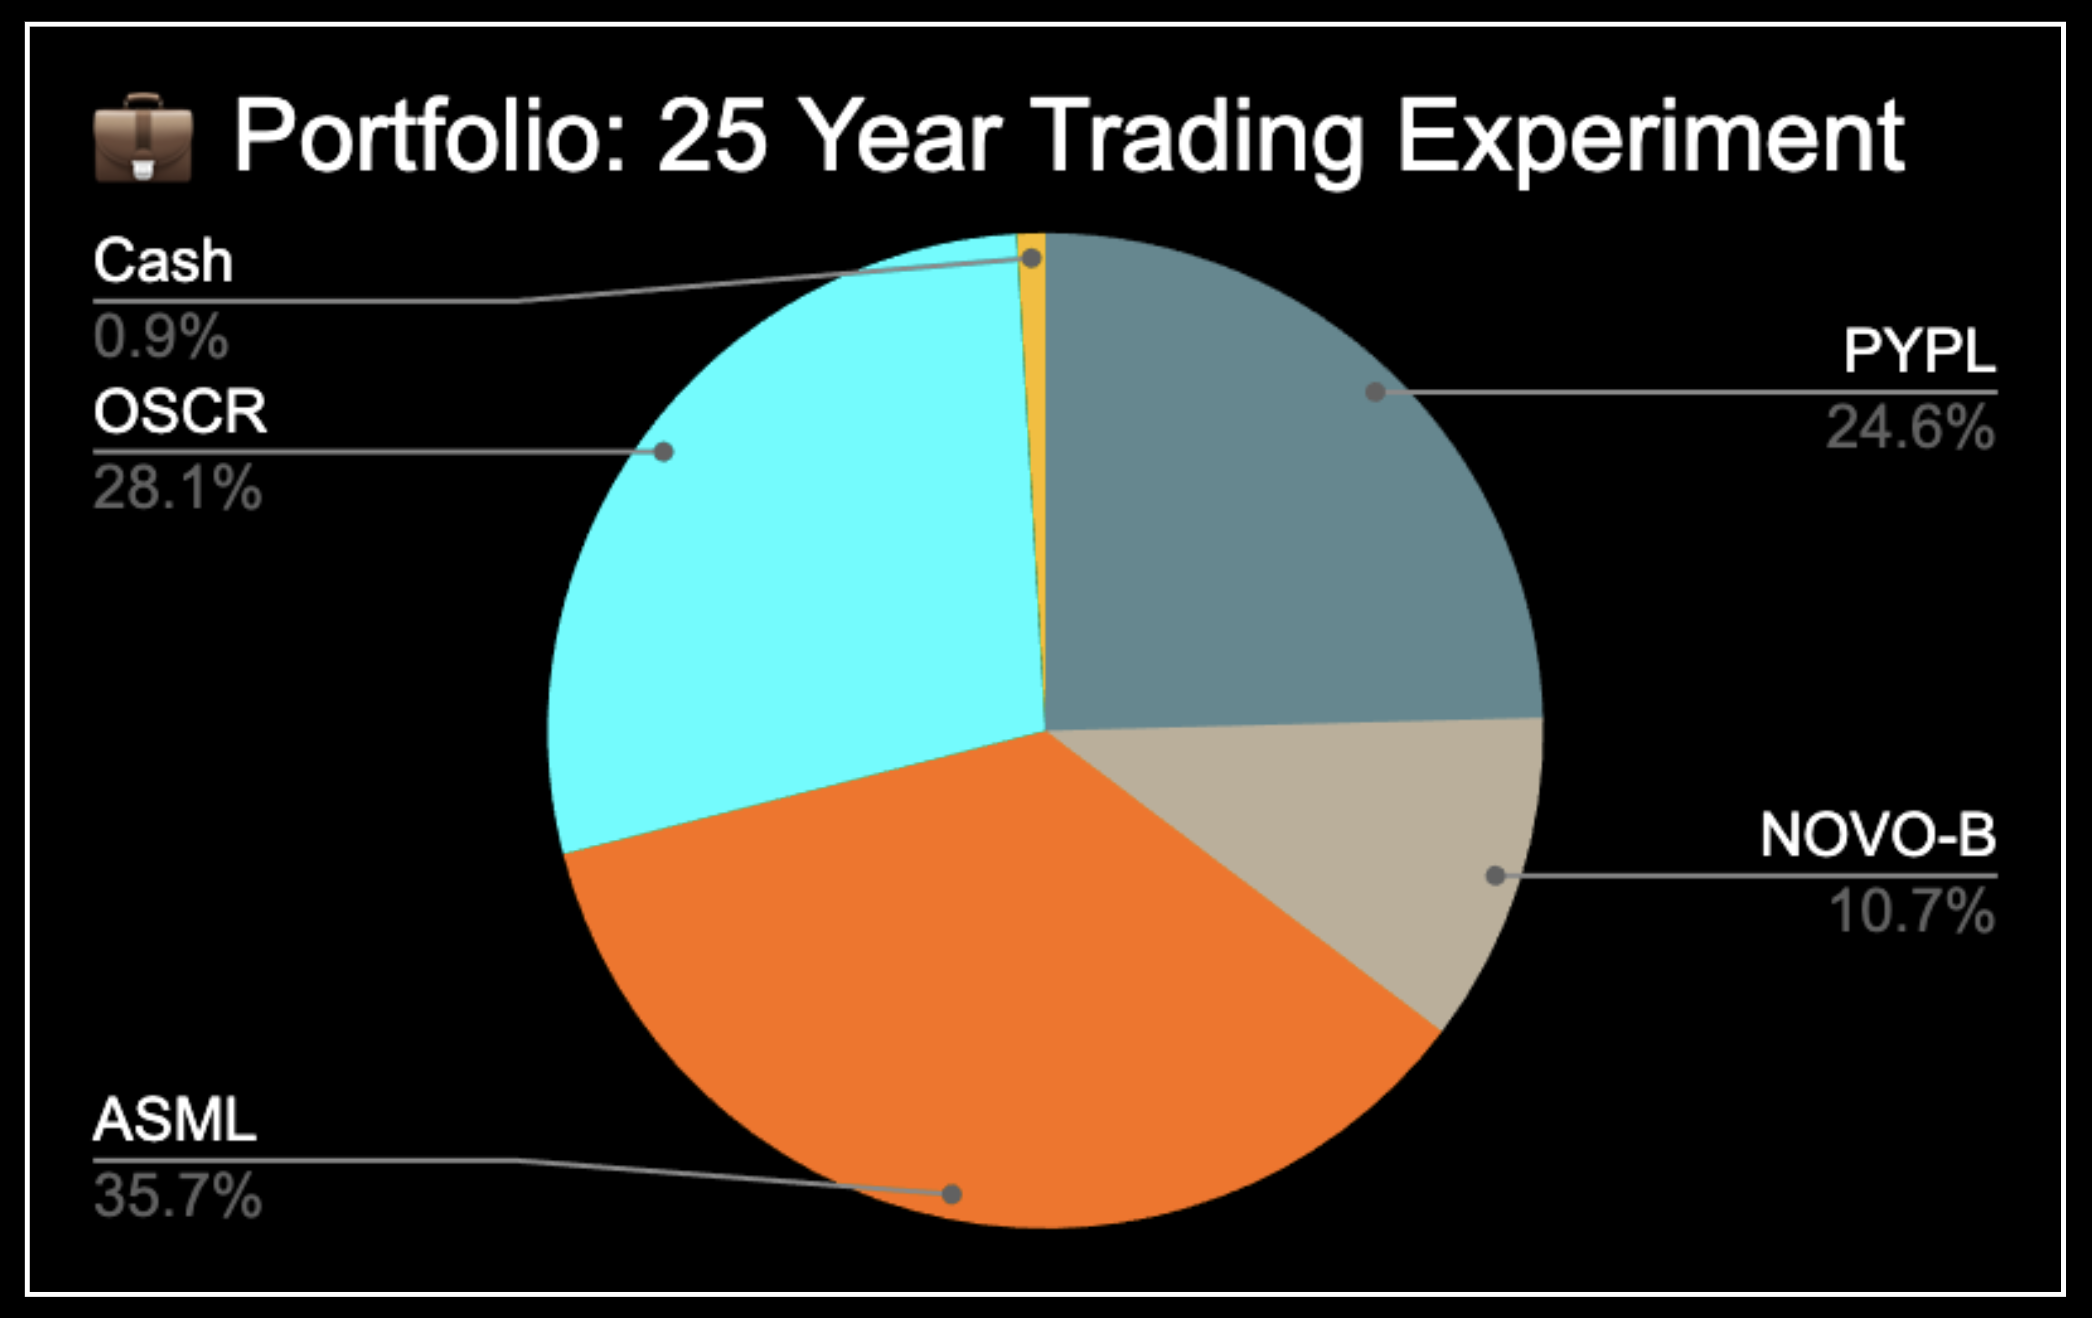 Open Positions
The total risk of invested capital is currently ⚠️ 20% with a range of risk per trade from 3% to 7.4%.
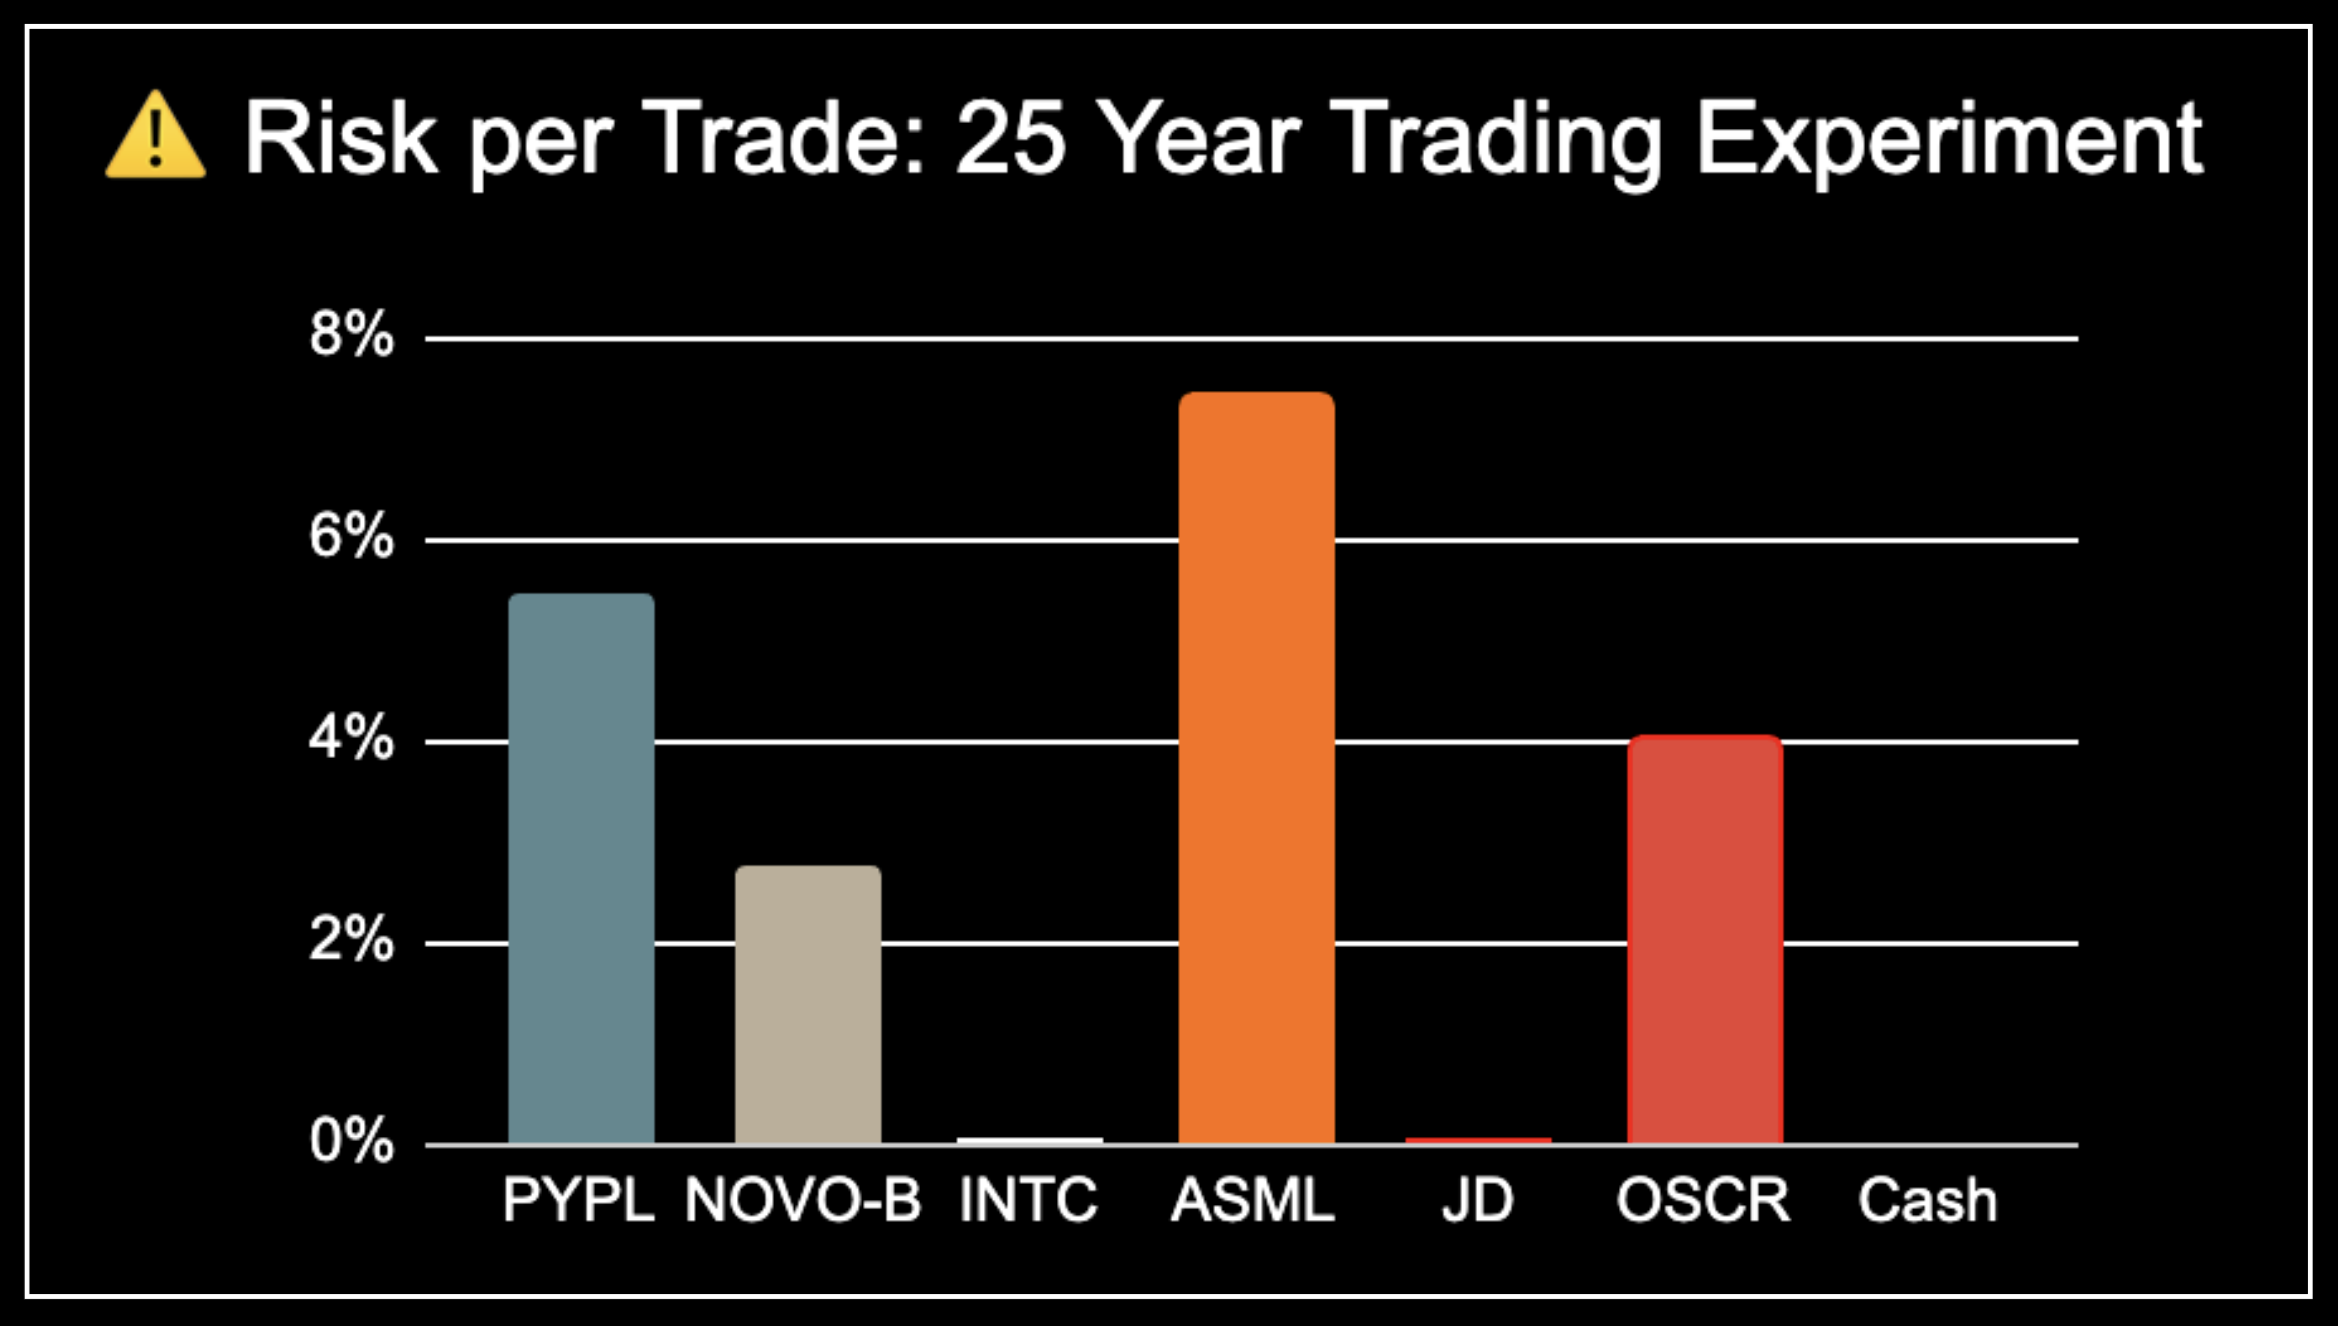 Risk per Trade
Open Positions: Detailed Overview
The following table contains the entry, stop loss, position size, and current market prices.
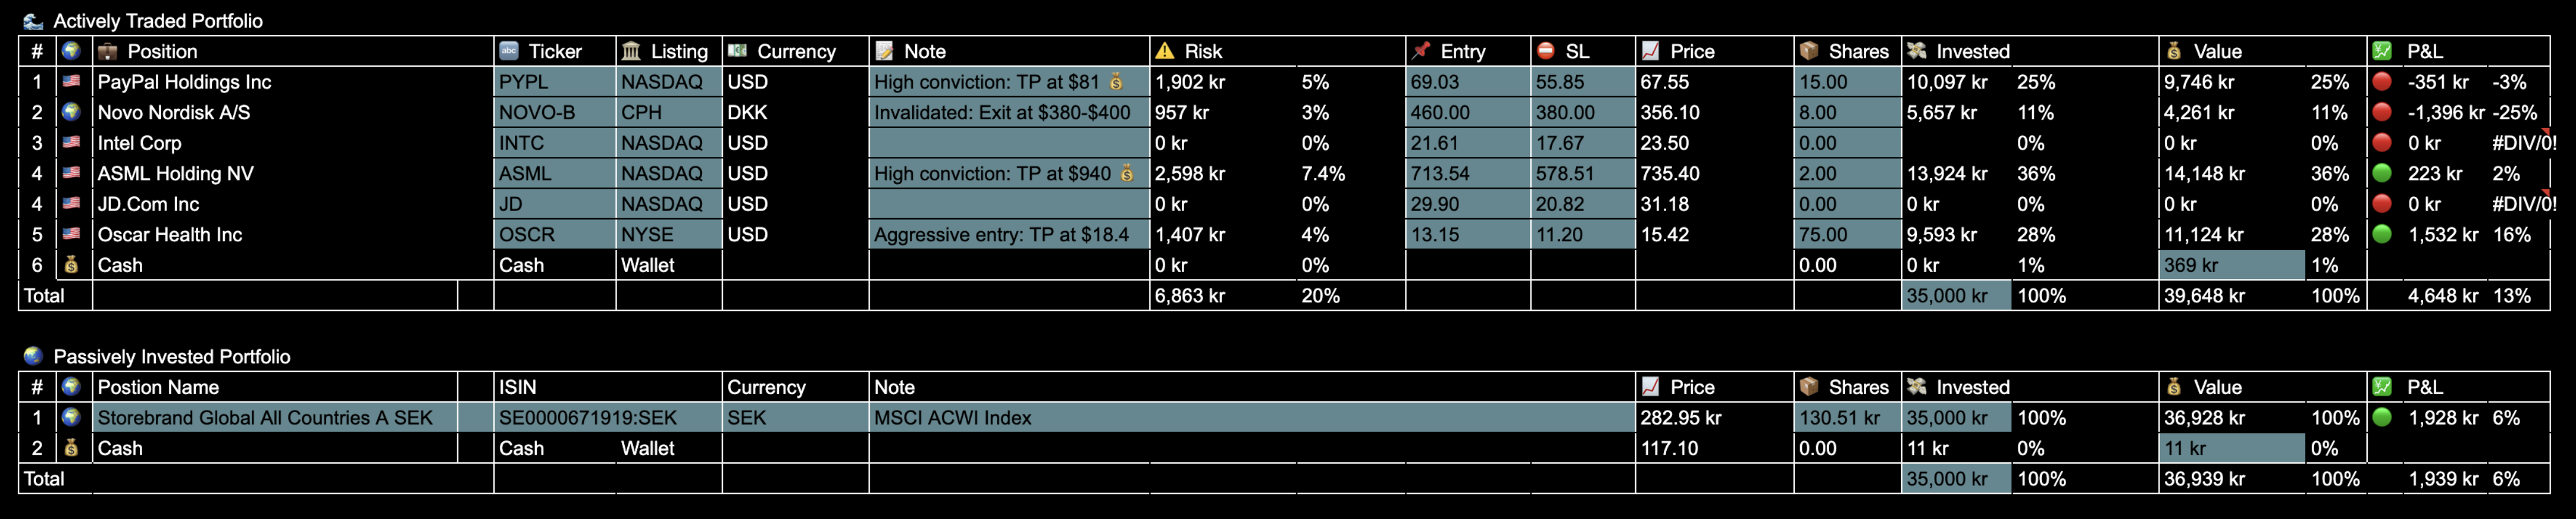 Open Trade: Details
Realized P&L
Since inception, I have realized 11 trades:
- 🟢 5 Winners
- 🔴 3 Losses
- 🟡 3 Break-even (+- 3%)
The best trades percentage-wise have been $BABA, $CRSP, $NOVO and $TSLA, each delivering between 19% and 40% from entry to exit. Losses have been modest, with a maximum realized loss of just 7.2%. Trade durations have ranged from 3 to 148 days.
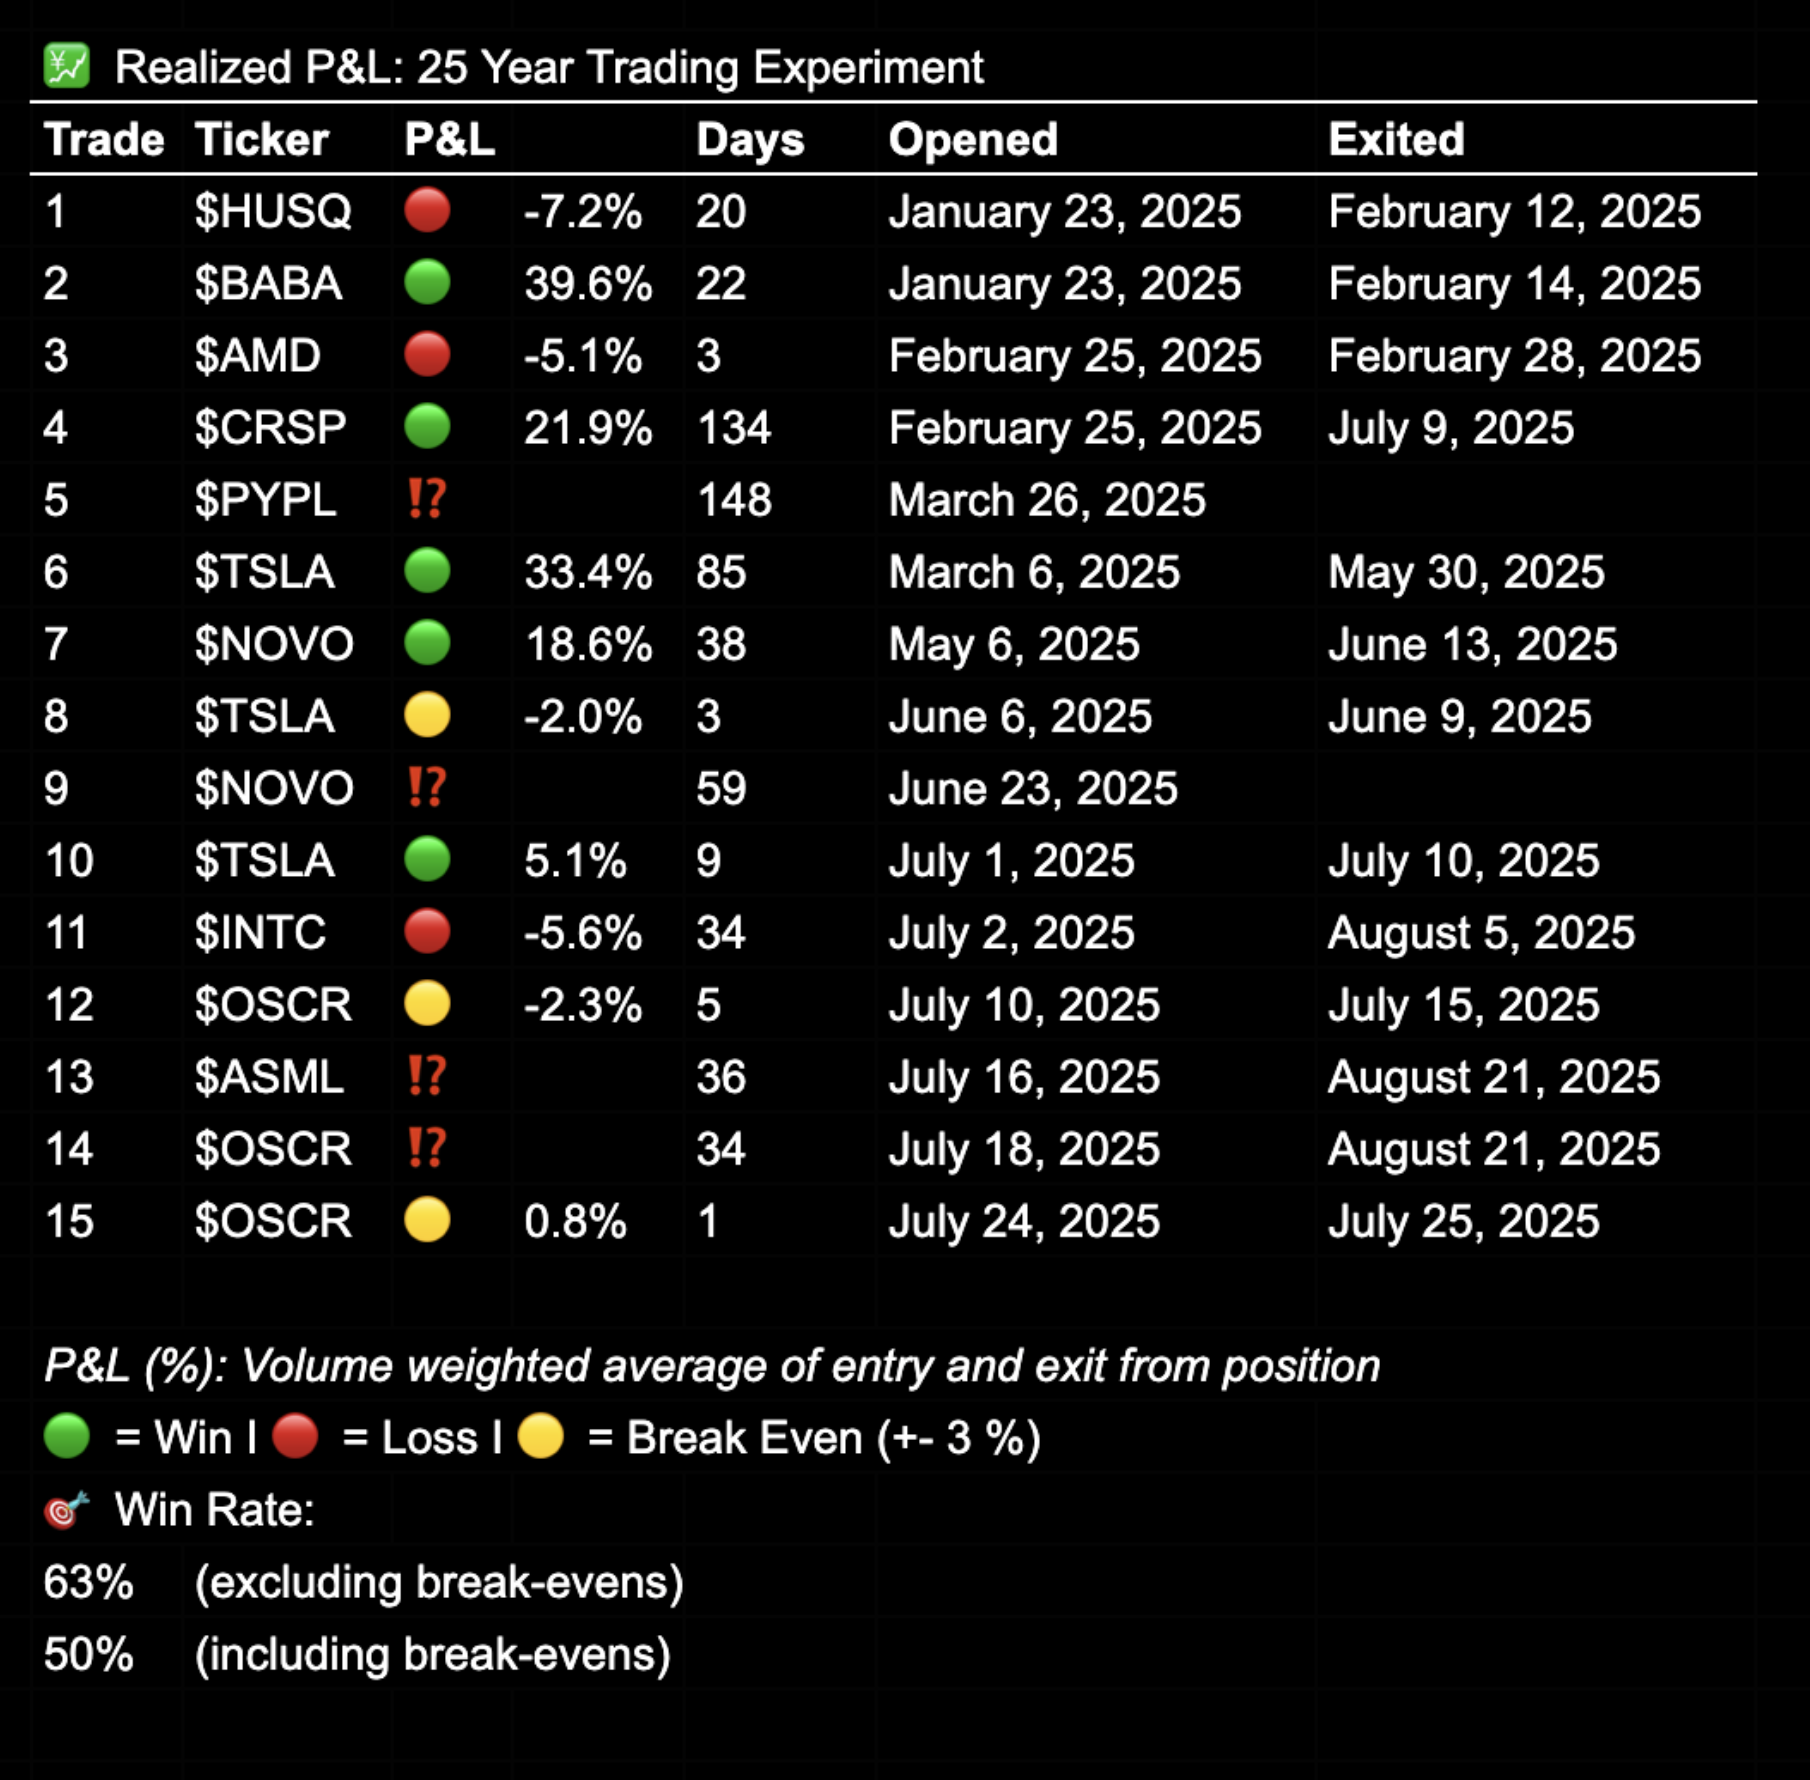
Realized P&L
25 Year Trading Experiment
For a full overview of the experiment’s purpose and structure, check out my First Post from January 2025, or watch the previously released YouTube introduction.
In short:
- 💰 10,000 SEK (~$1000) invested monthly - split 50/50
- 🌊 Actively Traded vs 🌍 Passively Invested Global Index Fund
- 📅 Contributions on the 22nd of every month.
- 🕰 Tracking my performance from 2025 to 2050.
- 🌐 Transparency: Every trade shared publicly.
Summary
7 months and the portfolios are steadily growing month by month. The year-to-date performance has decreased slightly from the previous month. But it is quite fulfilling to see that it has been almost 70% green month so far. It will be interesting to see if I will be able to keep this performance going. As an outperforming 8% on a long-term basis would have a significant impact on the Actively Traded Portfolio.
How are you tracking your trading performance?
💬 Share your thoughts on X or Substack — I’m always interested in connecting with like-minded people.